The National Integrated Drought Information System (NIDIS), a multifederal government agency partnership that coordinates drought monitoring, forecasting, planning and information at national, state and local levels across the U.S., defines an “agricultural drought” as a phenomenon in which weather conditions lead to adverse plant responses, leading to outcomes that range from reduced crop and forage yields to complete crop and forage failure. Identifying a historical example of an agricultural drought is an easy task for most members of the Idaho agricultural community. In 2021, drought conditions during the planting season and high heat during the growing season resulted in substantially lower yields for most crops – and in many rain-fed cases led to complete crop and pasture losses.

The goal of this article is to put the 2021 agricultural drought in Idaho into historical perspective. Or, in other words, this article tries to answer the question: How bad was 2021 relative to the past?
The first part of the analysis in the article compares statewide crop yields 2021 for barley, potatoes and wheat with those since 1980. This analysis allows for identification of agricultural drought years which, for purposes of this article, are those for which estimated yields were substantially below the historical trend.
The second part of the analysis examines the U.S. Drought Monitor maps (recent maps are commonly included in the opening pages of Ag Proud), produced jointly by the National Drought Mitigation Center and the University of Nebraska – Lincoln, for agricultural drought years identified in the first part of the analysis since 2000, which is the first that are available. Specifically, the drought conditions for the growing season of April to September are described regarding the region in Idaho that experienced extreme drought and the growing season months in which at least one region had extreme drought.
The analyzed yield data are annual estimates from the USDA National Agricultural Statistics Service (USDA-NASS) for 1980 to 2021. To estimate a historical trendline yield for each crop, a simple regression was estimated with USDA-NASS yields as the dependent variable and a time/year variable that increases from 1 in 1980 to 42 in 2021 as the independent variable. This is the same trendline estimation strategy that is built into Excel when “insert a trendline” is selected on a chart that plots data over time. The estimated yields and yield trendlines are plotted over the observation period for each crop in the figure (trendline in light brown and yield estimates in color – see Figure 1).
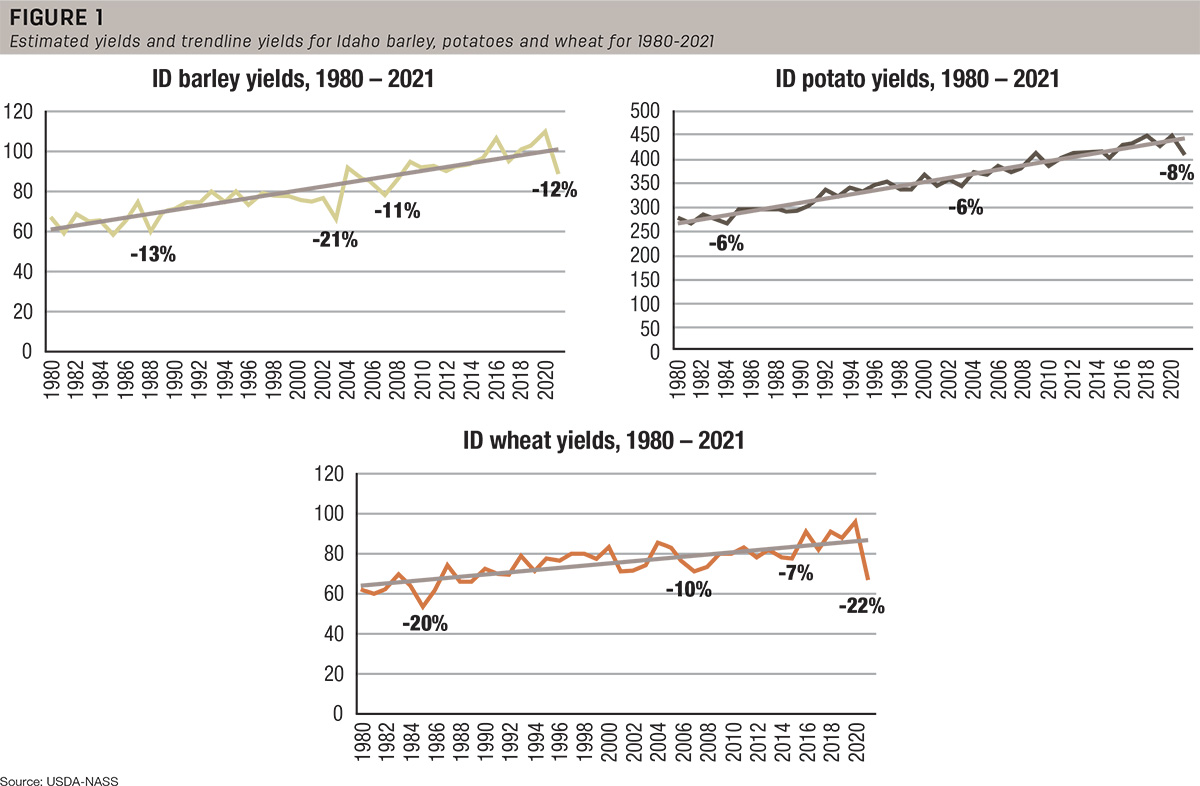
The observed trend of increasing yields over time for all crops is attributed to technological advances such as planting improved seed varieties and implementing better management practices. It is observed that the 2021 yields for each crop (barley with 89 bushels per acre, potatoes with 410 hundredweight per acre and wheat with 67 bushels per acre) were all substantially below trend. Indeed, the deviations from the trend, which are indicated in the figure with percentages for the years for which the negative deviations were the largest, were greater in 2021 than any year since 1980 for potatoes and wheat (1985 was close with a -20% deviation) and third-greatest for barley (1988 and 2003 were greater). Thus, considering the yield impacts for all three crops collectively in a historical context, the 2021 agricultural drought in Idaho was one of the most severe in the past 42 years.
Other than 2021, the years identified as having substantial negative deviations from yield trends since 2000 vary across crops: 2003 and 2007 for barley, 2003 for potatoes, and 2007 and 2015 for wheat.
The next portion of the analysis examines the U.S. Drought Monitor maps for the growing season period of April to September for 2003, 2007, 2015 and 2021 (Table 1).
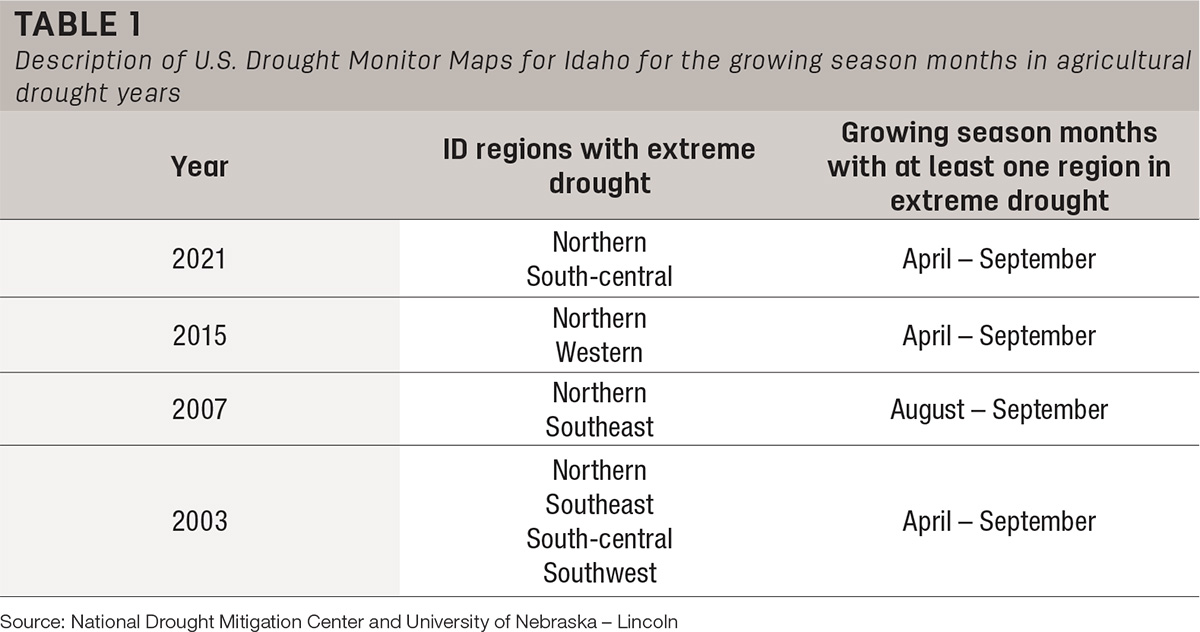
The analysis focused on identifying the geographic regions of Idaho that experienced extreme drought and the months of the growing season for which at least one region had extreme drought in these years.
There are several main takeaways from the information in the table. First, there is substantial variation regarding the regions that experienced extreme drought across the agricultural drought years, although northern Idaho experienced extreme drought in all analyzed years. Second, in three out of four of the agricultural drought years, there was at least one region in Idaho that was experiencing extreme drought by April. In 2007, the extreme drought did not emerge until August, and in the northern and southeast regions – but when it arrived, it had a severe detrimental effect on barley and wheat yields. Lastly, in 2003 and 2021 (the years with the largest deviations from trend yields for potatoes), extreme drought was observed throughout the growing season and in south-central Idaho.
To summarize, drought effects on yields of barley, potatoes and wheat in Idaho for 2021 were greater in magnitude regarding the deviation in estimated yields from yield trends than have been observed in many years. However, due to technological advances and improved grower management practices, which have led to an upward yield trend over time, estimated yields in 2021 were still higher than yields observed only a few years ago (especially for barley and potatoes).
Lastly, the observed deviations between estimated and trend yields were substantially smaller for potatoes than wheat and barley, which demonstrates the importance of irrigation in mitigating drought effects on crop yields. Thus, continued advancements in agricultural production technology, improvements in management practices and sustaining the availability of water for irrigation will be critical for mitigating the effects of drought on crop and forage production in Idaho in the future.


