Have you ever wondered if those additives you put in the feed at such low inclusion rates actually make it to each cow?
According to a recent Dairyhack survey, one-third of all nutritionists from participating farms sell only feed additives with their nutrition consulting. If one-third of nutritionists are peddling additives, wouldn’t it make sense to know if these feed additives are actually getting into cows at the right rates?
Feed additives are the most expensive part of the ration on a per pound basis. Feeding an ounce of this and an ounce of that adds up in a hurry.
Once you dump in your little handful per 100 cows, how do you know it didn’t just go to one cow in one bite?
One full batch of feed in my mixer is almost 15,000 pounds. Depending on feed moistures, that is roughly enough for 160 Jerseys. If I include a feed additive at 1 ounce per cow, that will be 10 pounds of dust mixed into 15,000 pounds of feed.
If you watch the feed when it is mixing, you can plainly see if the haylage didn’t mix evenly. You can plainly see if a chunk of dry hay didn’t get chewed up the way you would like.
What you can’t see is the 10 pounds of bicarb, yeast, microbial pack, probiotics or mycotoxin binder that you threw in there. Should you just trust that it went to every cow? Are you sure it isn’t stuck in the corners of the loader bucket?
I didn’t trust it. So I tested the mixer. With M&M’s.
Yep.
Sixty-six pounds of M&M’s.
I have always heard of this being a way to tell if you were getting a uniform mix. I have never witnessed a trial with M&M’s myself. The idea is M&M’s are brightly colored so you should be able to see them. They are also small. So they should disperse well throughout the mix, hopefully, similar to a feed additive with a low inclusion rate.
In fairness to feed additives, I should have dumped 10 pounds of M&M’s in to represent an equal size sample of 1 ounce per cow. This M&M trial would be closer to 6.6 ounces per cow. If I had used equal weights – the M&M’s being quite a bit larger than one speck of bicarb – the feed additives would get the edge for total surface area in the mix.
So what happened?
My nutritionist was also interested in seeing this trial take place. Naturally, I let him find and purchase the M&M’s. We used 33 pounds of plain chocolate M&M’s and 33 pounds of peanut M&M’s. (We made sure to weigh them after we ate our fill.) We also counted how many M&M’s of each kind were in an ounce. If you are wondering, 34 plain M&Ms are in 1 ounce and 12 peanut M&Ms are in 1 ounce.
With the candy weighed and ready, we decided to mix a half batch of feed so we would be certain to find the M&Ms when we were finished. We were not quite sure of the effect mixing would have on breaking down the M&M’s before we were done.
Our batch size of TMR was 7,970 pounds. We added the 66 pounds of M&M’s as the last ingredient. We mixed the load for four minutes at 1,600 rpm.
After we fed the load off, we each took a 5-gallon pail and collected samples along the length of the feed alley. We then took a subsample from each of the pails.
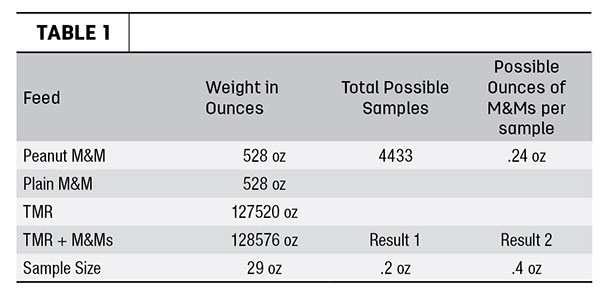
Both subsamples weighed in at 29 ounces. The amount of 29 ounces was basically a big handful, trying to mimic a bite a cow might take. We spread out and picked through the two samples to find all of the M&M’s.
In the first sample, there were no peanut M&M’s and seven plain M&M’s (two-tenths of an ounce). In the second sample, there were three peanut M&M’s and four chocolate M&M’s (four-tenths of an ounce). It’s interesting that in each sample we found the exact same number of M&M’s, but at different weights. If you were to divide our sample size (29 ounces) into the total feed (128,576 ounces), there were 4,433 possible samples in the entire mix. If you divide the total weight of the M&M’s (1,056 ounces) by the number of samples (4,433), a theoretical weight of 0.24 ounces of M&M’s per sample was possible. Our results of 0.2 ounces and 0.4 ounces were an acceptable result.
The physical observation of the feed was that there were many more peanut M&M’s at the end of the batch and that visibly separated themselves from the feed. It’s no wonder feed additives are ground so fine; particle size definitely plays a role in mix distribution. The other physical observation was that the silage acids certainly do take the food coloring off of an M&M, and some were starting to lose their integrity. If this had been a full load or a longer mix time, I believe the M&M’s would have been very hard to find.
Even with an aging mixer, we were pretty impressed to find the two samples to be so even. Overall, using a candy marker can be a pretty quick test to check mix distribution. If I were to do the trial over, I would use less candy and the same type of candy. Most likely Skittles, as they may not break down as fast. I would also be interested to try different time intervals. This trial of four minutes was what we mix at, and I was pretty happy to have the candy prove the mix was accurate.
Special thanks to George of George Pick Nutrition Consulting for his assistance and supplying the M&M’s. ![]()

-
Jim VanDerlinde
- Dairy Producer, Consultant
- Hillview Dairy
- Lewisburg, Pennsylvania
- Email Jim VanDerlinde
PHOTO: Jim VanDerlinde put his mixer to the test with M&M candy. He used 66 pounds of M&M's to see if the mixer was providing a uniform mix with additives. Photo provided by Jim VanDerlinde.


