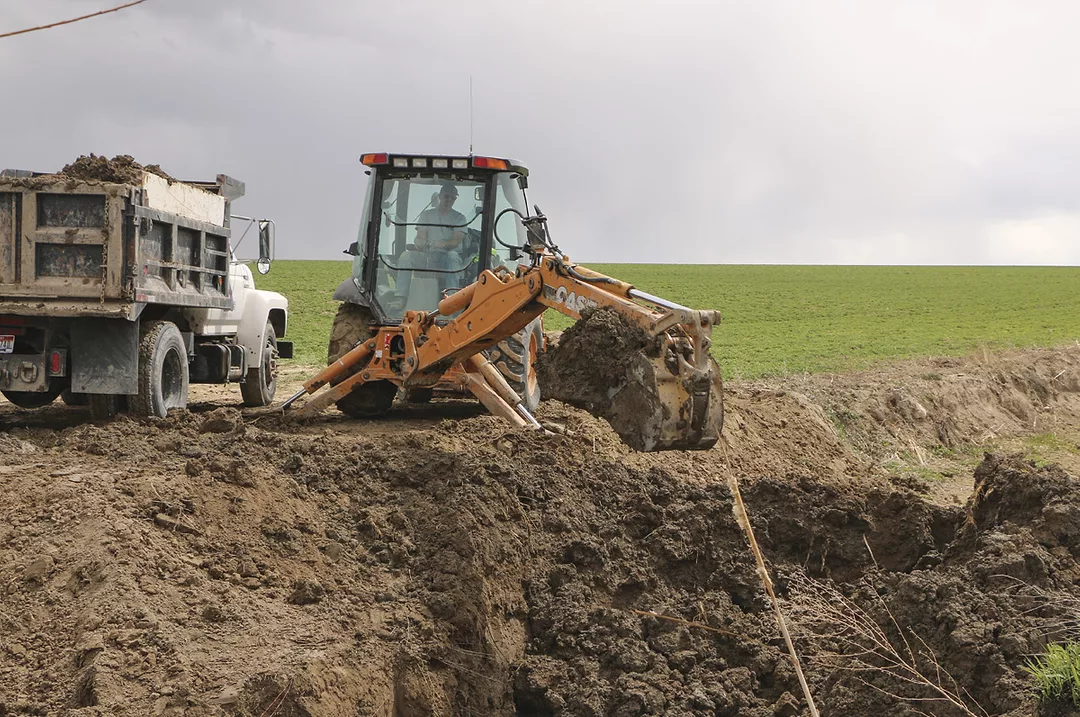
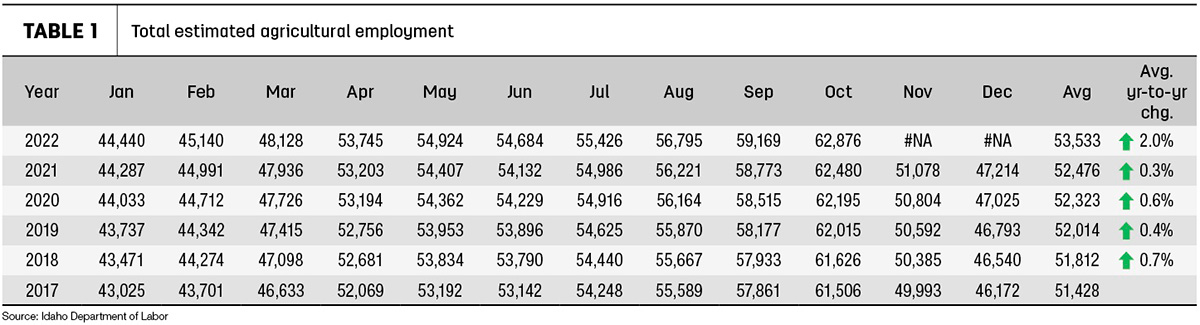
Statewide ag employment for Idaho has had a fairly consistent pattern over the past five years, as it tends to peak in August, September and October (up to 62,876 workers), then dive to 44,000-plus change in the deep winter months. The yearly average continues to rise year-over-year, however. As of this writing, data through October 2022 was provided through Idaho Labor Department (see Table 1).

Canyon County heads the list for the Idaho county with the most ag workers with 5,748 average employment jobs (up 3.06% from 2021). Other top counties are Bingham (3,629 workers, up 3.11%), Jerome (3,446 workers, up 2.5%), Twin Falls (3,284 workers, up 0.54%) and Cassia (2,944 workers, up 1.2%). Counties with the fewest ag workers include Shoshone, Valley, Boise, Clark and Clearwater.
See numbers for specific counties at the Idaho Department of Labor website.
These labor estimates include operators and hired employees. In 2022, Idaho shows 27% of ag employment is held by farm operators, while 72% are hired workforce and 1% is unpaid.
Migrant seasonal farmworkers (MSFW) by county do not strictly follow the counties with the most employment ag jobs. Bingham County reported the most seasonal migrant workers in 2022 with 2,596. The other top counties included Canyon (2,450 MSFW), Cassia (1,137 MSFW), Power (1,097 MSFW) and Madison (1,096 MSFW).
What the rural workforce looks like in the rest of the nation
Your farm and rural workforce is changing in very specific ways. The USDA Economic Research Service (ERS) has identified which segments are growing faster than others, and what some of those factors entail in their latest report, Rural America at a Glance (James C. Davis, Anil Rupasingha, John Cromartie and Austin Sanders). Here is a brief recap of (excerpted from) that report (which is not specific to ag employment but shows trends in general rural employment).
Over the past decade, the rural population in the U.S. has decreased overall, but the pandemic turned that around. Sharp migration flowed from metropolitan areas to rural areas in 2020-21.
During the 2010s, data showed rural population declining by 0.6%, while metropolitan areas grew by 8%. In rural counties, the population was 46.1 million in July 2021, with 14% of the U.S. population residing in 72% of the nation’s land area.
The difference in metro and non-metro population rates of growth began closing after 2016 as birth rates took a steep decline nationwide; as a result, metro population growth declined. The overall U.S. population aged over the last 20 years as the baby boom generation entered their 60s and 70s. Historical patterns of out-migration among young adults and in-migration of older adults to rural retirement destinations have accelerated this aging trend in rural areas.
Also impacting rural populations is the fact that the rural population is aging, and the working-age population is declining.
The report states that the overall decline in population growth and increase in average age in rural areas affect the makeup and availability of the rural labor force. In 2021, people 65 years and older made up more than 20% of the non-metro population for the first time in U.S. census history, up from 16% in 2010. In metro areas, just 16% of the population was 65 and older in 2021. During the 2010-20 decade, the non-metro working-age population declined by 4.9%, and the population under age 18 declined by 5.7%, while the population 65 years and older grew by 22%. The working-age population continued increasing in metro areas during the 2010s, although at a much lower rate than for adults aged 65 and older
The rural workforce has become more diverse in the share of employment categorized as all other races and/or Hispanic in recent years, though it remains less diverse than the urban workforce. Between 2012 and 2019, the rural Black, Asian and Hispanic workforces each increased, with rural growth in the Hispanic workforce outpacing metro area growth. In addition, employment growth rates were higher for all other races and/or Hispanic workers than for White workers in every rural industry except agriculture.
Metropolitan (metro) and non-metropolitan (non-metro) population trends shifted dramatically with the onset of the pandemic in 2020. Population growth in metro areas was 0.5% from July 2018 to July 2019 but fell to an unprecedented low of 0.1% growth during the same period from 2020 to 2021. Increasing death rates from the pandemic combined with record-low births and out-migration from metro areas contributed to the decline of population growth to near zero.
Natural population change (births minus deaths) also declined in non-metro areas in recent years. In fact, non-metro areas began showing an overall natural decrease (more deaths than births) for the first time beginning in 2017. The rate remained close to zero until, with the arrival of COVID-19, the natural change went from a 0.005% decline in 2018-19 to a 0.3% decline over 2020-21.
The overall U.S. population has been aging as the baby boom generation entered their 60s and 70s. In non-metro areas, this aging trend was accelerated by historical patterns of out-migration among young adults and in-migration of older adults to rural retirement destinations. In 2021, people 65 years and older made up over 20% of the non-metro population for the first time in history, compared with 16% of the metro population. Corresponding declines in the relative size of the working-age population (18-64 years) were also higher in non-metro areas. In 2021, 58% of non-metro residents were 18-64 years old, compared with 61% of metro residents.
The aging of the baby boom generation not yet aged 65 in 2021 will continue to contribute to the loss of working-age adults through the end of this decade. Declines in the working-age population may make it harder to meet labor demands in some rural industries and local labor markets. At the same time, many rural areas lack sufficient health care capacity, broadband service, community centers and other services to address the challenges associated with an aging population.
Productivity doesn’t dive
One important driver for changes in agricultural jobs was increased productivity. Though agricultural employment fell over time, agricultural output increased substantially. Non-metro agricultural labor productivity, defined here as output (industry GDP) per worker, increased because of technological innovation, some of which included labor-saving technologies. Agricultural labor productivity increased between 2001 and 2006, slowed through the Great Recession and grew again after 2012.
References omitted but are available upon request. Click here to email an editor.