

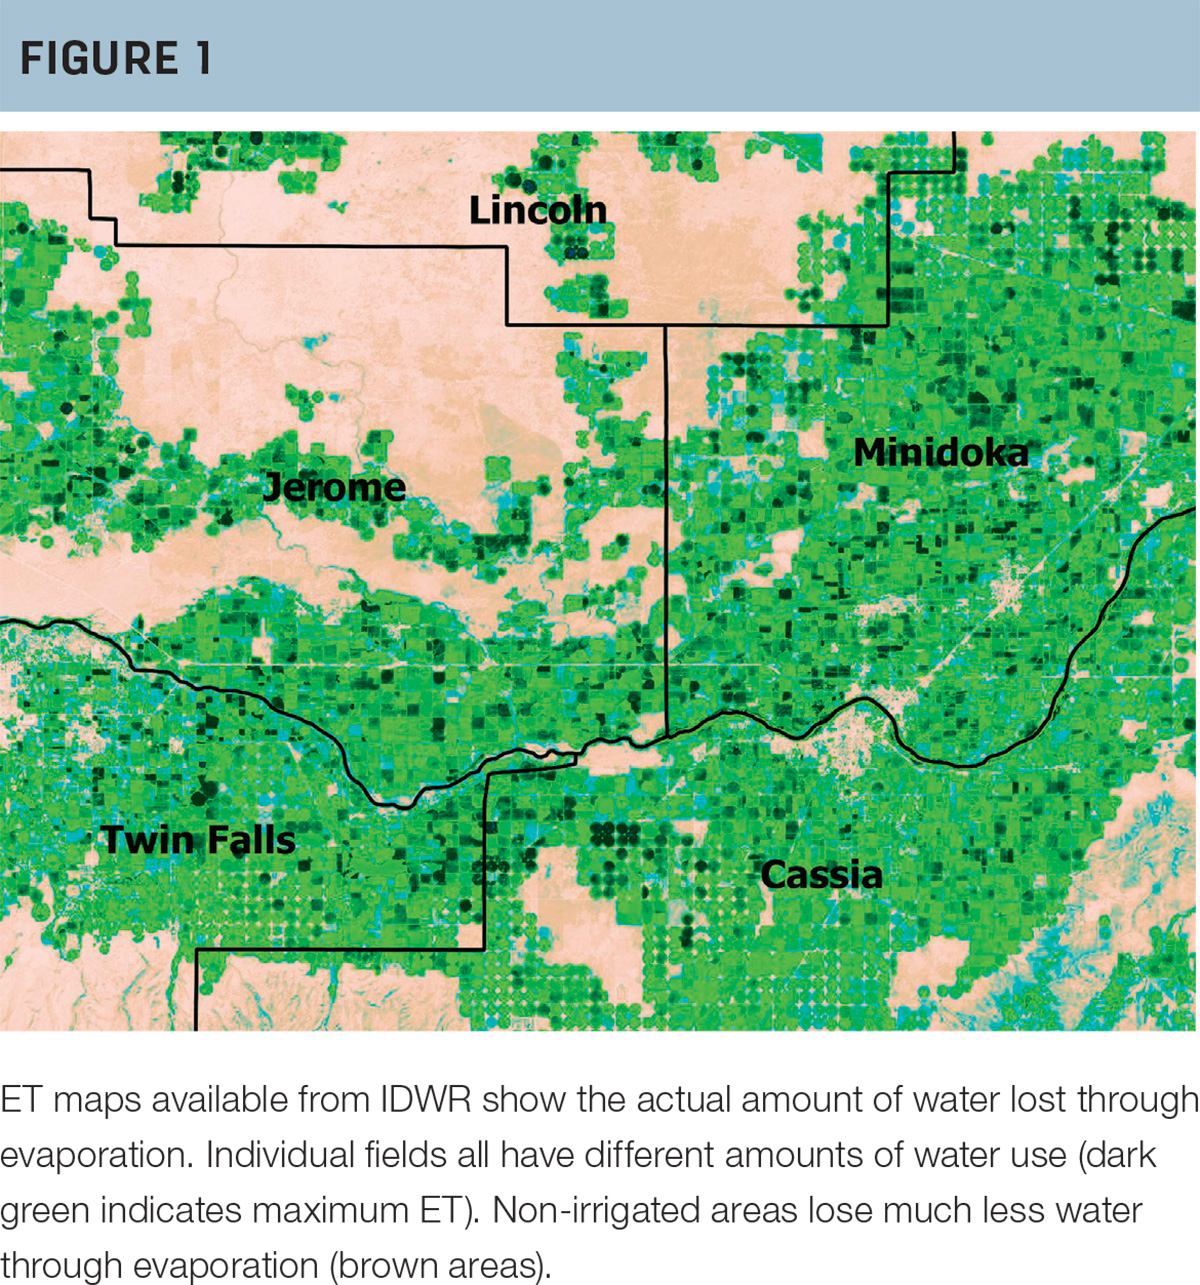
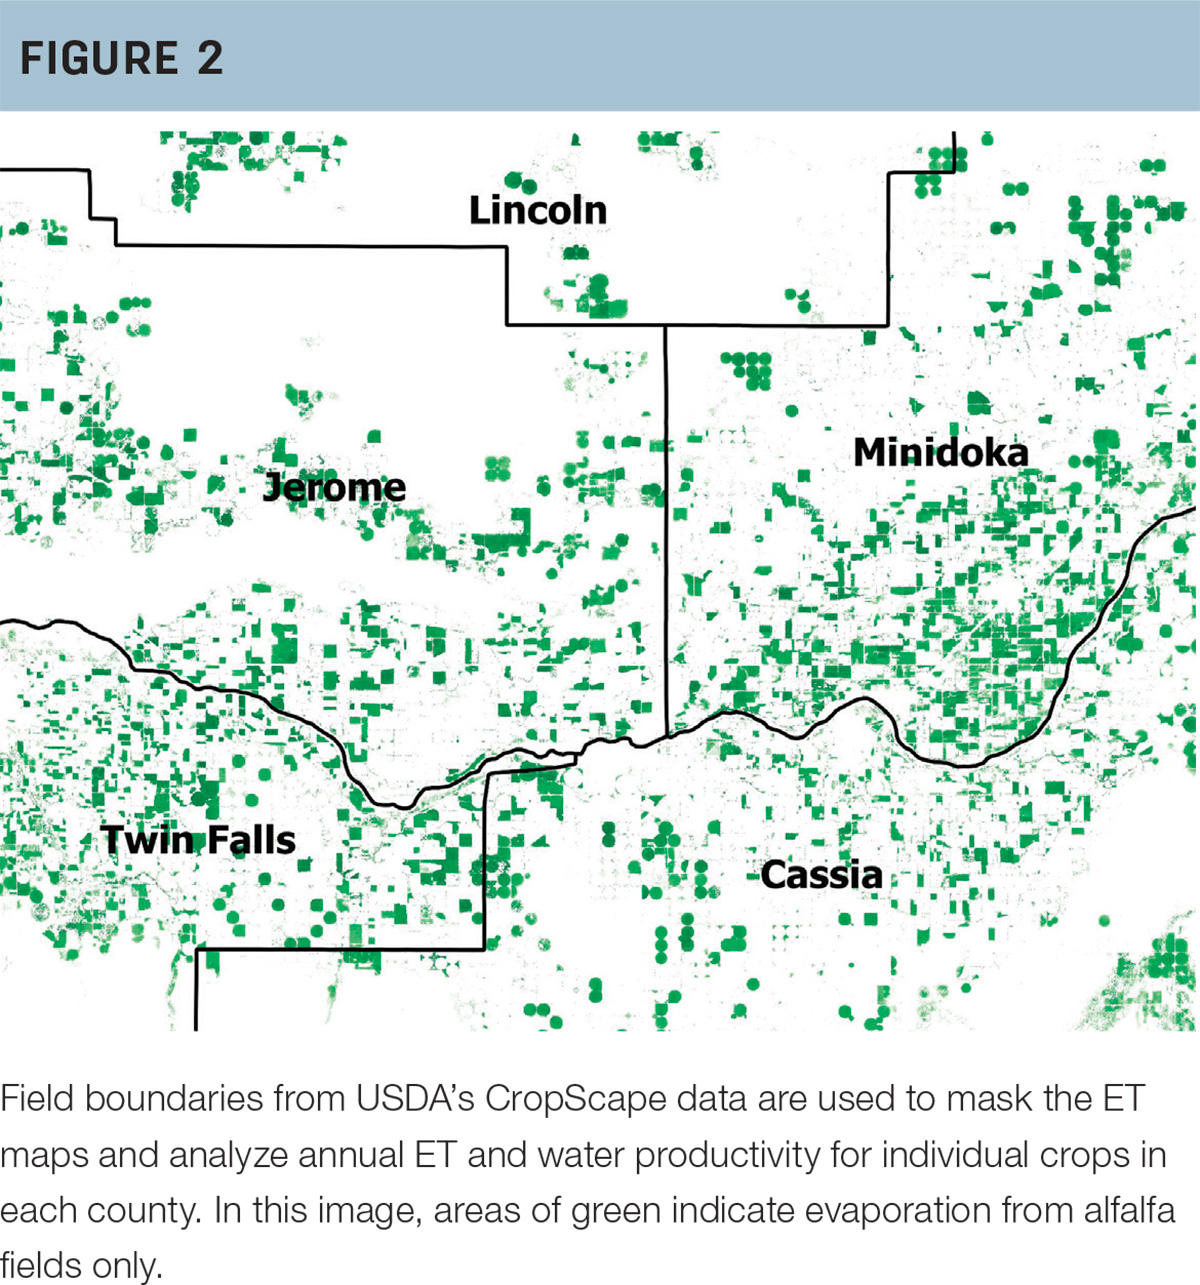
A recent study published in Agricultural Water Management shows how public crop yield statistics and satellite data can be used to track trends in water productivity for major crops grown on the East Snake Plain. Idaho’s Department of Water Resources provides annual and monthly maps of the total water use across the Eastern Snake Plain, based on satellite imagery which reveals how much water is lost through evaporation across the entire landscape (sometimes referred to as evapotranspiration or “ET maps”). The USDA’s National Agricultural Statistics Service provides annual yield statistics which are compiled from county-level yield records for major crops, as well as field maps of crops grown. By combining the ET maps, crop maps and yield records in each calendar year, it is possible to calculate the water productivity.
In this article and in the study, water productivity means “the amount of crop produced for a given amount of water lost through evaporation and crop transpiration.” Water productivity is similar and connected to the related concept of “water use efficiency.” Improving the efficiency of irrigation and reducing wasteful consumption are the main goals in managing limited water resources, and this method to track changes in water productivity over time helps ensure that conservation efforts are actually reducing consumption and saving water.
In the published study, ET map data and yield records were obtained from counties within the East Snake Plain for nine years between 2009 and 2019. In the years when satellite ET maps were produced, alfalfa, wheat and barley yield records were also available from most of these 21 counties. Other important factors affecting irrigation requirements are water supply and the weather. Although this study did not directly consider water supply, evaporative demand was included by using reference ET data from USBR’s Agrimet network of weather stations. Using these data allowed the study to control for some of the influence of weather and climate variability over the period 2009-19.
The results of the study showed different trends among the three crops and in different areas of the East Snake Plain, over the course of the 10 years. The biggest difference can be seen by comparing grain crops with alfalfa production. For wheat and barley, water productivity tends to drop as water use increases because while yields increase when water supply is sufficient, marginal yield increases don’t keep pace with increased ET when there is abundant water supply. On the other hand, alfalfa grown in dry areas or drought years often outperforms alfalfa grown with ample water supply. This can be attributed largely to partial harvests (fewer cuttings) which can take advantage of water available in the early season even when supplementary irrigation isn’t available. More subtle trends can be detected when comparing different geographic areas, for other crops and when comparing dry and wet years. The study notes that applying this water productivity technique can help stakeholders utilize publicly available data and evaluate the effectiveness of conservation measures and irrigation efficiency technology.
An important feature of the satellite ET maps is that they give consistent estimates of evaporation and consumptive water use everywhere. In comparison, crop water requirements and consumptive use estimates based on pump meters, weather stations or groundwater models are not necessarily measured the same in all locations. Similarly, water duty and water rights are prescriptive, so there is no objective way to suggest improvements or increase efficiency. Although the models used to make these maps still have some uncertainty, the relative error is consistent and this facilitates an equal statistical treatment across an entire geographic area. The data used in the IDWR maps is especially transparent by using Landsat satellite data, which are publicly owned and have decades of operational history to ensure consistency and reliability.
Water consumption (evapotranspiration) varies year to year, as does crop yield, according to weather and water availability. Since yield and evaporation are both tied to the amount of applied irrigation, water productivity reflects the total water use efficiency across broad geographic areas. Positive trends in water productivity shown in the study over the 2009-19 decade reflect improved utilization of diverted water, after controlling for climate and weather variability. On the other hand, flat or negative trends in water productivity shown by specific sub-regions or for particular crops may indicate that substantial challenges remain to increase water use efficiency in these situations. Overall, this study shows a straightforward way to utilize publicly funded satellite monitoring programs and evaluate the effectiveness of conservation measures enacted at state and local levels.
References omitted but are available upon request. Click here to email an editor.
Follow-up discussion with Jason Kelley
Q: Can you explain the term “water duty”?
A: Water duty refers to the prescriptive amount of water applied on an annual basis in a given area for a specific crop or more generally. You may have heard this in a description like, “Alfalfa takes 3 feet of water a year.” Another example is: A 160-acre parcel may have a water right associated with a historic water duty of 400 acre-feet, and if the irrigated acreage is reduced by installing a pivot (watering only around 120 acres), putting on the same volume of water increases the applied depth by 33%.
Q: Would you say water use in small-grain crops is not worth as much as it is in alfalfa (for instance)? Where does silage corn fit?
A: I wouldn’t say water use in alfalfa is worth more than water use by grain crops. Partly, this is because the yield is different (grain versus hay, etc.) and partly because worth is more of an overall statement of beneficial use. A ton of grain certainly has different value than a ton of hay.
I would say water use by alfalfa is more flexible than water use for the grain crops. Alfalfa can take advantage of less water because a smaller but substantial harvest can be obtained from fewer cuttings early in the season. If there isn’t enough water to ripen the grain, the water use is just wasted.
I did do similar analysis for other crops, including corn silage and corn grain, but there were not enough annual yield records from enough counties to compare fairly with alfalfa, wheat and barley.


