
It would be reasonable for most of us to assume median and average would be relatively the same when it comes to snowpack water equivalency, snow depth, streamflow volume and reservoir storage. Mathematicians know different, and researchers have looked for more accurate data, which is why Natural Resources Conservation Service (NRCS) has updated their “normals” in these datasets. It may seem like a small difference, but as important as water is to Idaho agriculture, farmers and ranchers closely follow these reports, and all water managers should be aware of even minor adjustments in data reporting. In other words, the calculations behind the teacup graphs (for instance) will be a little different – and it’s a difference that bears noting.

The following is excerpted from the NRCS special report, issued Dec. 23, 2021.
Beginning Oct. 1, 2021, the Snow Survey & Water Supply Forecasting (SSWSF) Program transitioned to new hydroclimatic normals for the most recent 30-year period (1991-2020). All variables with reference normals now use the median as the measure of central tendency. This report includes detailed information pertaining to the methodology used to create the updated normals, as well as potential impacts the updated normals could have on snowpack and water supply interpretations.
SSWSF normals refer to the measure of central tendency used for a given data type over a sufficiently long period of time. For example, when referring to a given SNOTEL site’s inches of snow water equivalent (SWE), it is useful to contextualize that value against the range of values previously observed at that site for the same time of year. By providing a percent of normal, water users are able to quickly assess how the current data compares to past conditions.
The statistical median of a dataset is the number where half of the data points are lower and half are higher – it’s the exact middle point of the dataset. Meanwhile, the statistical average is the number resulting from the summation of all data points within the dataset divided by the total number of data points. The median and average statistic are often quite similar; however, large outlier events (i.e., floods, droughts) can skew the average higher or lower than the middle point (median) of a dataset. For this reason, the use of medians is generally recommended for natural phenomena that experience occasional large outlier events, such as extreme floods for streamflow discharge data. In such situations, the “normal” value produced by the median statistic will typically be lower than that produced by the average because averages are disproportionately influenced by those large (or small) infrequent events.
Every 10 years, the SSWSF Program updates normals for the previous 30-year intervals consistent with the World Meteorological Organization (WMO) standards in recognition of changing climatic conditions that impact these parameters.
The change from average to median as the normal reference statistic for precipitation and streamflow has mostly resulted in decreased reference values throughout the Idaho network. These decreases appear to be primarily a function of differences in central tendency statistics (i.e., median versus average) rather than climatological differences between the two reference periods. For snow water equivalent, the impact of updated reference normals is less pronounced since the median was previously used as its measure of central tendency, so the largest component of change results from climatological differences between reference periods.
All SSWSF parameters now base what is considered “normal” on the median as the measure of central tendency. Again, these parameters are snow water equivalent (SWE), snow depth (snow course data only), precipitation accumulation, streamflow volume and reservoir storage. All of these parameters previously used average as the measure of central tendency except for SWE.
New snowpack statistics
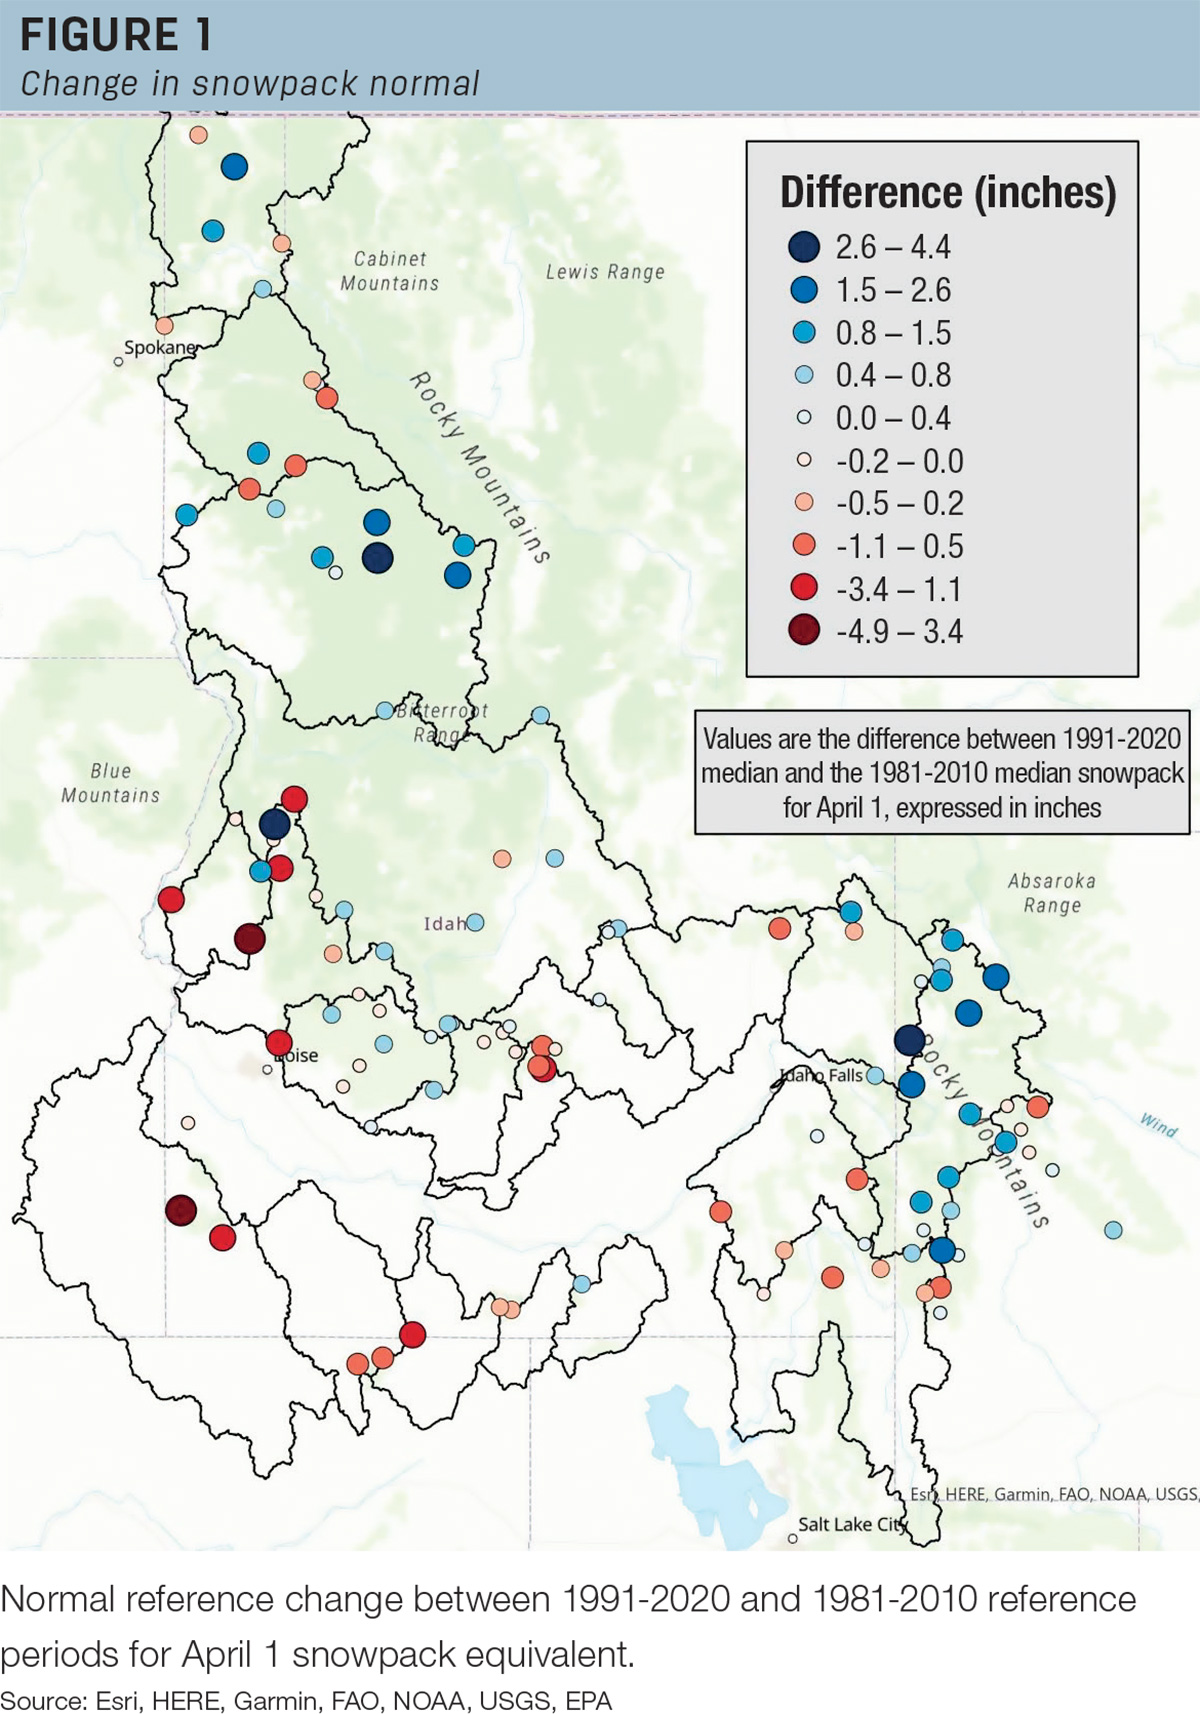
As outlined in the SSWSF Reference Guide, several additional snowpack statistics are now available to assist with snowpack and water resource investigations and management. These include updated process for calculating peak SWE, date of peak SWE, SWE onset date and SWE melt-out date. Regarding the latter, the removal of the smoothing process allows users to assign a normal value to the date that snowpack starts accumulating (onset) and completely melts out. The median melt-out date, for example, is the day of year when SWE values go to zero for half of the years within the 1991-2020 period. Likewise, the SWE onset date is the day of year when SWE values are above zero for half of the years within the 1991-2020 period. This difference is shown in Figure 1, where the difference between averages and medians ranges are represented.
The impact for agriculture
Water and resource managers should be aware of the impact these updated normals may have on interpretations of snowpack and water supply conditions going forward. As noted elsewhere, the change from average to median as the normal reference statistic for precipitation and streamflow has mostly resulted in decreased reference values. These decreases appear to be primarily a function of differences in central tendency statistics (i.e., median versus average) rather than climatological differences between the two reference periods.
Therefore, it’s important for those who make operational water management and agricultural decisions, especially those who rely heavily on percent of normal information, to carefully consider the underlying reference data.
A key takeaway from this report is that differences in updated normals are more pronounced for precipitation and streamflow parameters because they include statistical differences (average to median) as well as climatological differences between the 1981-2010 and 1991-2020 reference periods.
Questions regarding updated normal? Email Idaho snow survey homepage


