A common concept introduced in agricultural economics courses that focus on risk is that of the “natural hedge.” To summarize, the natural hedge relates to the commonly observed phenomena in some crop markets in which prices and yields tend to have an inverse relationship. That is, when crop yields are low (high), corresponding crop prices are commonly high (low). Thus, under a scenario in which area harvested and the quantity sold remain relatively constant, total revenue, equal to the quantity produced multiplied by the price, will also be close to the same across years with substantially different average yields. In this article, I describe the concept of the natural hedge in more detail and examine historical data to investigate the extent to which the natural hedge has applied in Idaho for barley, potatoes and wheat over the past decade.

A closer look at the natural hedge
Although it was implied in the introductory paragraph, it is important to clearly state that the natural hedge is a marketwide concept. Namely, the variables of focus (prices, yields and revenues) are averages across the set of observations that comprise the market of analysis.
Using a crop market for Idaho as an example (and ignoring for now that many of Idaho’s crop markets are linked to national and global markets) for any period, the supply portion of the market for the period of observation is the sum of total production across all producers that grow that crop, and the demand portion is the sum of all consumers, processors and other crop buyers. Thus, suppose there is a drought during the growing season in a major-producing area of Idaho (e.g., northern Idaho in the 2021 growing season). Total production is measured by summing up the total production of all producers, some of which may have had close to zero yields, while others who were less drought affected would have closer to normal yields.
In this scenario, the overall lower production causes the price to increase as demanders must bid higher amounts to obtain the crop under lower availability. Those who have a positive yield can benefit from the higher prices, and those who have zero yields cannot (but hopefully have crop insurance to provide revenue support). The overall market revenue may be close to the same if the natural hedge applies, but the distribution of total revenue across producers varies.
Natural hedge diagram
To illustrate the concept of the natural hedge as a diagram, Figure 1 includes four panels. The top left panel represents the base scenario. Demand (D1) and supply (S1) achieve equilibrium at a corresponding price (P) and quantity demanded/supplied (Q). The box represents total revenue (TR = P*Q).
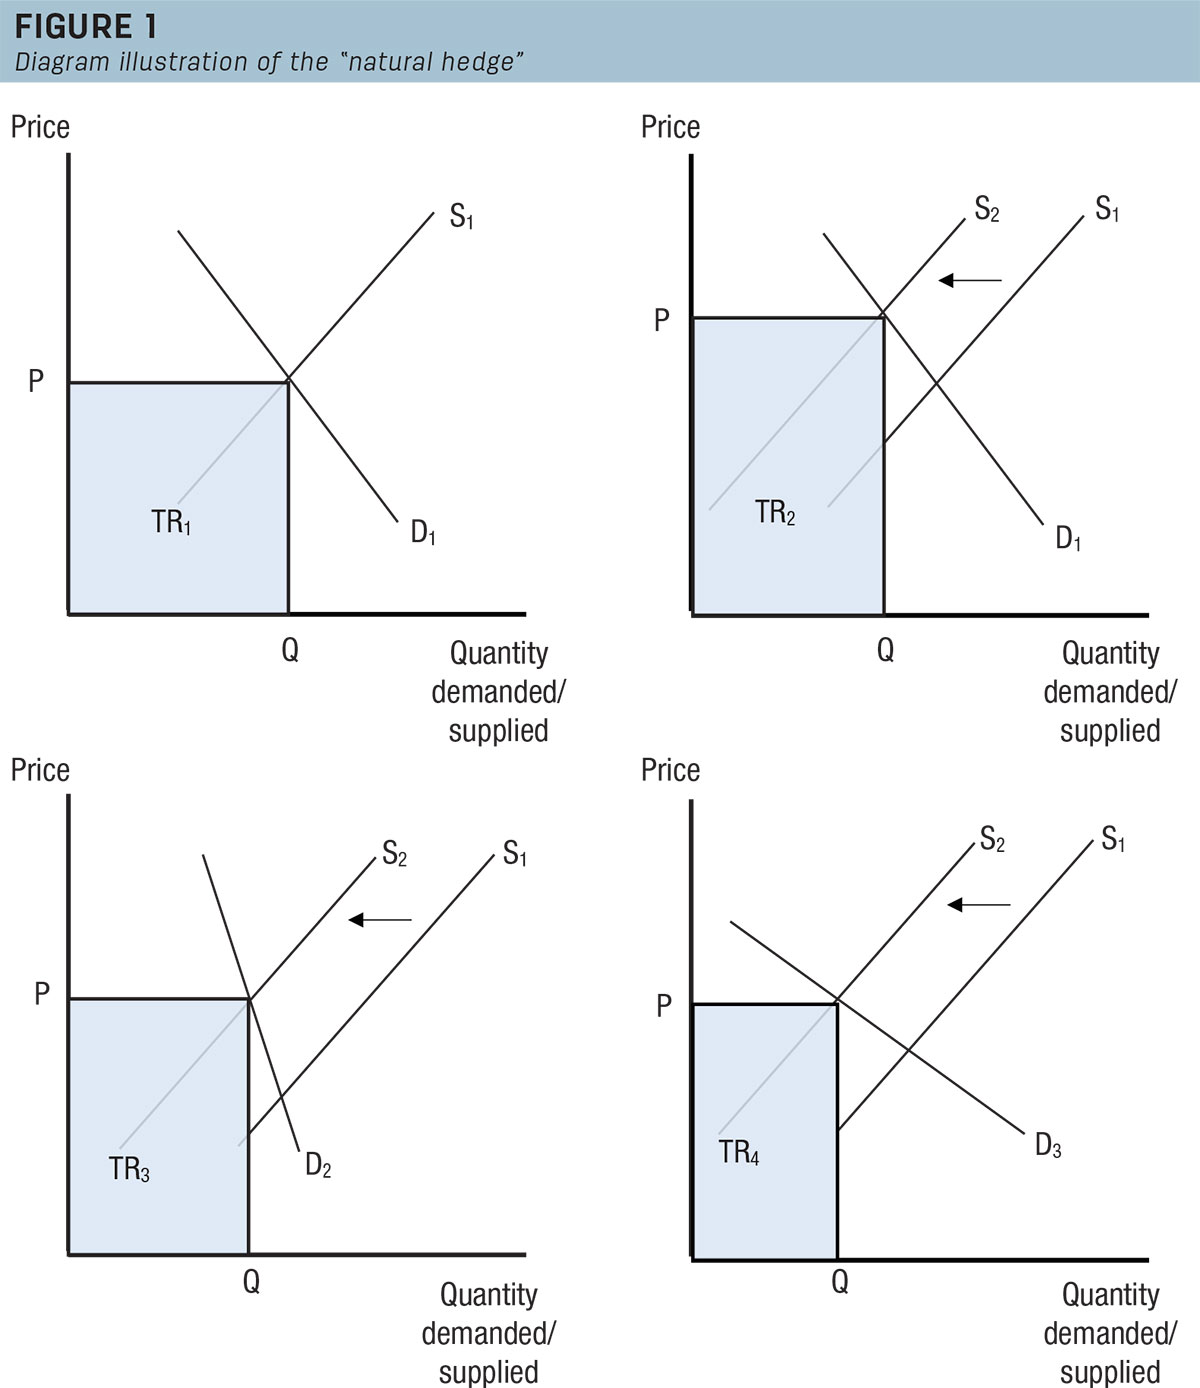
The top right panel represents the case in which there was a supply shortfall, perhaps due to drought. In this case, the structure of market demand (i.e., the responsiveness of quantity demanded to a price change) remained the same, but supply reduced from S1 to S2. The equilibrium price under the supply shortfall was higher, while the corresponding quantity demanded/supplied was lower. Since all else remained constant, the higher price compensated equally for the lower quantity demanded/supplied, so total revenue remained the same (TR1 equals TR2) despite the supply shortfall. This is how the natural hedge works.
The top two panels: A main takeaway from the top two panels in Figure 1 was that the extent to which the natural hedge applied depended on the nature of demand (or the extent to which the quantity demanded changed with change in prices). In the field of economics, this relationship between quantity demanded and the price is the “price elasticity of demand.”
The bottom left panel maintains the drought scenario (supply decrease), but the price elasticity of demand is inelastic (or in other words, the quantity demanded did not change much despite a relatively large increase in price).
The bottom right panel maintains the drought scenario (supply decrease), but there is price elastic demand in which a small price change corresponded with a relatively large change in quantity demanded.
The bottom two panels: Under a drought situation (supply decrease), with price inelastic demand, higher prices can imply higher revenue, while with price elastic demand, higher prices imply lower revenue, such that TR3 is greater than TR4. The main message from this illustration is that for revenue to increase under a supply decrease scenario, demand must be price inelastic.
To what extent does the natural hedge apply in Idaho?
To investigate the extent to which the natural hedge applies in Idaho, I obtained data for Idaho cash receipts, prices and yields for barley, potatoes and wheat from 2008 to 2020. I then calculated the correlation coefficients between these variables. For reference, a correlation coefficient equal to 1 implies that a 10% change in one variable corresponds with a 10% change in the other variable in the same direction (i.e., if the change is positive then both variables move upward together by an equal amount). A correlation coefficient equal to -1 has a similar interpretation, except the variables move in the opposite direction (i.e., a positive change for one variable corresponds to a negative change for the other variable of an equal amount). A correlation coefficient equal to zero means the variables do not adjust in either a similar or opposite manner.
The results for the correlation coefficient calculations (Table 1) show a negative relationship between yields and prices for all crops.
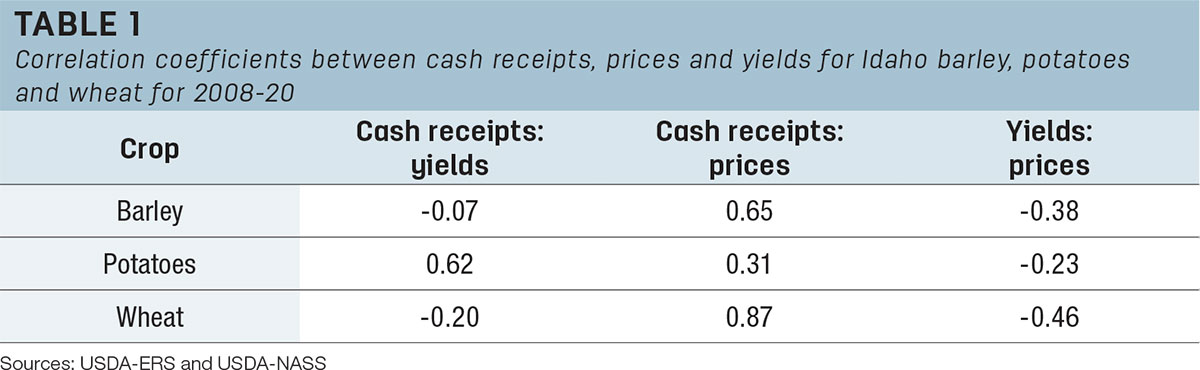
That is, on average, when yields are higher (lower), prices tend to be lower (higher). However, there is a positive relationship between cash receipts and yields for potatoes, while that between cash receipts and yields for barley and wheat is negative but close to zero.
This implies that potato revenues move closely with yields, such that price adjustments are not typically sufficient to make up for yield declines in a supply decrease situation. The cash receipt and yield correlation coefficient that is close to zero for barley and wheat means that if yields are low in a supply decrease scenario, then higher prices tend to compensate to keep cash receipts relatively stable. These results imply that the natural hedge applies relatively more for wheat and barley than potatoes.
These differences in relative correlations of cash receipts, prices and yields across crops can be explained by factors including the extent to which Idaho yields are correlated with those in other major growing regions for these crops and the relative importance of supply and demand conditions on global markets.
Barley, potatoes and wheat
There are two main takeaway messages from this article.
First, the extent to which the natural hedge applies depends on the market structure, and associated characteristics such as the price elasticity of demand, or the extent to which quantity demanded/supplied responds to price changes.
Second, the estimated correlation coefficients between Idaho barley, potato and wheat cash receipts, prices and yields imply the natural hedge applies more for barley and wheat than potatoes.
In a general sense, these results imply that in Idaho, total cash receipts for these crops are determined more by local growing conditions for potatoes, while they are determined by external factors on the national or global markets for barley and wheat. Thus, while the natural hedge can be expected to help preserve revenue to some degree in a supply decrease scenario, and more so for barley and wheat than potatoes, continuing to utilize tools that minimize yield risk (e.g., irrigation), negative revenue effects from yield reductions (crop insurance), and/or price risk (e.g., contracts with processors or other buyers) will remain important.