In today’s challenging economic times, it is more important than ever to know the value of the alfalfa forage you feed your dairy or beef cattle. Whether you are blending alfalfa in a ration to maximize lactation, fertility, calf growth or utilizing lesser-quality hay for dry cattle or replacements, you want to know that you are consistently getting the most value for your dollar.
Many of us have relied on core samples and traditional lab tests for years. Although we have all dealt with some variability between labs, the far greater problem is sampling the crop.
With traditional core testing, it is very difficult to get a sample that represents the entire stack. In addition to this problem, it is not uncommon to have significant variation with a given bale.
The challenges compound as we unknowingly add unrecognized variations in quality into our feed rations and then witness unexplained fluctuations in cattle production or performance levels.
Today there is a new technology emerging in the arena of relative feed value (RFV) testing for alfalfa hay. Because it provides the RFV for every bale produced, this method of testing will allow the dairyman or beef producer to know precisely what each bale is bringing to the ration (although RFV itself is not directly used to calculate rations in current software models).
In addition to feeding considerations, the hay producer can use this value as a marketing tool for his commodity. This new method of measuring RFV was developed by Harvest Tec, Hudson, Wisconsin, and has been tested against lab results of individual bales from eight farms over six states since 2013.
Because the system calculates the RFV on every bale as it is produced in the field, the hay can be sorted into quality grades as it is stacked – and therefore shipped to the customer with the same consistent RFV, bale for bale.
How it works: In order to utilize this technology, the hay producer acquires the program from his equipment dealer (i.e., AGCO, New Holland, etc.) and downloads the program into the applicator or moisture-reading system on the baler.
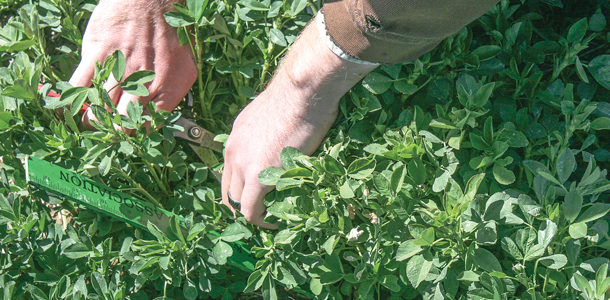
The operator then takes a scissor sample just before cutting, or a windrow sample at the time of cutting, and sends this sample to a lab. At the time of baling, the operator enters the data from the lab sample into the system.
The information from the sample is used to calibrate the system, allowing for the quality of the stand including variations in maturity and other factors.
Gary McManus, owner of one of the test farms in Lakeview, Oregon, says, “Grabbing a few windrow samples, sending them into the lab and entering the results when I start is a lot easier than trying to core representative bales later on.”
Then as the operator bales the hay, the system uses the information from the lab sample as a base line, representing the stand before any leaf shatter.
As the baler operates, dual star wheel sensors measure crop moisture readings 96 times every three seconds to determine a moisture content level of plus or minus 1 percent accuracy. The baler’s scale provides the bale weight to within 2 percent accuracy.
Based on the premise that the majority of the nutrient value of alfalfa is contained within the leaf, and that more density equates to higher leaf-to-stem ratio, the system analyzes the moisture content and bale weight data inputs, and then calculates the dry matter density and the RFV of each bale produced based on the sample previously sent to a lab.
The operator can then utilize this information as it appears on the system’s screen to calculate an average for a field. The results can be printed for the field, or a bale tagging system can attach a radio-frequency identification tag (RFID) to the bale that can be read with a hand-held or stationary scanner from the point of retrieval from the field all the way to the feed ration.
The RFID tagger attaches a vinyl tag containing an RFID chip to the number-six twine on the bale, then writes valuable information to the tag before the bale is ejected from the chamber, including bale moisture, weight, RFV, bale number, the time the bale was made, field location and more.
Dr. Allen Young of Utah State University performed some of the first comparative tests during the crop season of 2013. This initial work was performed on farms owned and operated by Utah State University Agricultural Experiment Station.
According to Dr. Young’s report, samples were taken from 546 bales from three fields over three cuttings. He says, “The system seems to work and appears to be a practical way to get a reasonable approximation of the quality of hay as it comes out of the field ….” (For Dr. Young’s full report go to www.harvesttec.com/relative-feed-value)
In addition to the preliminary RFV testing to determine the accuracy of the system, Dr. Young was requested to sort alfalfa hay bales from the study into a feed ration-balancing program to determine what effect this would have on projected milk output based on metabolizable energy (ME) and metabolizable protein (MP).
As Dr. Young states in his report (Hay Study, USU, Addendum), “The base ration was adapted from the ration used at the USU Caine Dairy and formulated for 90 pounds milk, 3.7 percent fat, 3.2 percent protein and 60 pounds DM per cow per day (model calculation).
The ration was a high-forage ration (about 59 percent forage AF; 36.3 pounds DM from forage of which alfalfa hay constituted 61.7 percent of forage DM).” He then divided the hay produced for the previous RFV system test into various groups of RFV values. Young then applied each group to the feed ration-balancing program (based on actual analysis of the hay) and measured the results of each trial.
These diets were formulated to utilize a high-forage diet, and it is important to keep in mind that alfalfa grown in the intermountain area is more consistent than that grown in some other regions due to growing conditions.
Dr. Young goes on to state, “However, it is obvious from the scenarios where hay was sorted by CP percent and RFV that there is variation within a field that can show changes in milk production of about 3 to 4 pounds ME milk or 4 to 6 pounds MP milk (depending on the field; in our rations MP was more limiting than ME).”
Over the past two growing seasons, additional private studies have been performed on eight farms across six different states, culminating in more than 3,000 bales tested by the in-field RFV system and compared with core samples sent to conventional laboratories.
These bales were produced under different conditions of temperature, alfalfa varieties, cuttings, irrigated and non-irrigated fields, and made by different makes of balers and bale sizes. The results uniformly demonstrate that the bales tested by the in-field RFV system closely follow the values generated by laboratory tested core samples, and there is less variation in the values calculated by the system.
Jeff Roberts, president of Harvest Tec, states, “Our calculated value represents the RFV of the entire bale. We feel this system is revolutionary in the production of alfalfa. We are adding precision to the testing of hay that was not available before.”
McManus says, “What is really useful is having the RFV on the screen while I am baling. I thought as moisture increases, RFV would also increase, which I learned is not always the case.
I went out one morning and was watching the RFV monitor, thinking ‘this hay should test better than that,’ so I shut down and went back to the house. I came back to that field later that night, and sure enough, the RFV jumped 20 points greater than what it had been that morning.” FG
Michael Thomas is a freelance writer from Salmon, Idaho.
PHOTO
A scissor sample just before cutting or a windrow sample at the time of cutting is taken and sent to a lab for analysis. This data is used in the in-field RFV calculation to determine RFV per bale. Photo by FG staff.
