


Decisions will be made based on a one-time snapshot, and the information can be incorrect or influenced by outlier conditions. Benchmarking data within your own herd will allow you to not have to just react to negative situations and will allow you to prevent problems and capitalize on opportunities.
Benchmarking milk production data and trends is beneficial to finding efficiencies in your herd. It needs to be done correctly and within a single herd, not among herds. We know what works on one dairy will not always work on another dairy. Similarly, analyzing data from one herd and comparing it to another herd can be misleading. It is more important to follow trends within a herd to find opportunities for improvement.
Looking at milk production records from one test may not be the best scenario to make management and nutrition decisions. It is important to track production within a herd on a consistent monthly basis to see trends. These trends can be influenced by seasonal changes, management changes or nutritional changes.
One way to narrow down the information is to first break down milk test data or weekly milk production records by lactation. Separate your herd into first-lactation, second-lactation and third-lactation-and-greater (mature cows). Then break down the lactation cycle by days in milk (DIM) stages. There are five stages of milk production to track: one to 40 DIM; 41 to 100 DIM; 101 to 200 DIM; 201 to 305 DIM; and greater than 305 DIM.
After you have the herd’s data broken down into these groups and stages, you can keep track of these records every month so there is a visual graph of every stage for multiple months. The trends within a stage are much more visible when they appear in a graph form.
In the example in Figure 1, if you were only to have looked at records in March, decisions could have been based on poor information.
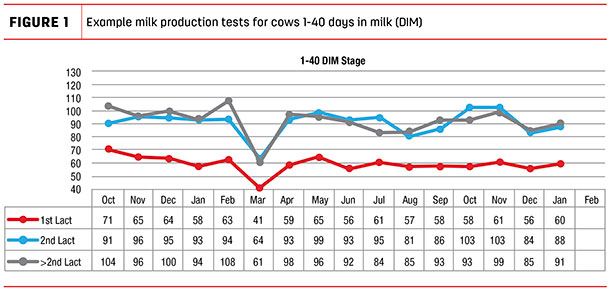
Chances are, the test in March was probably bad information or a bad test, meaning the data is an outlier and should be ignored.
Analysis of the data is much easier when the data is separated by stages. For example, one area you can look at is one to 40 DIM in first lactation and compare that to one to 40 DIM in mature cows. A goal I try to achieve on our customers’ herds is to have first-lactation cows at 65 to 70 percent of mature cows. The example above is showing first-lactation fresh cows are 66 percent of mature fresh cows in January.
If first-lactation cows are not reaching this level, then questions can be asked about the size of springers calving, health of springers through transition, dry matter intake (DMI) of springers during pre-fresh and fresh cow pens. In the above example, if we make decisions and changes to increase fresh milk in mature cows, we need to see improvement in first-lactation cows as well.
Another area you can compare is second-lactation cows throughout the stages of lactation to see if they are at least 90 percent of mature cows. If they are not meeting this level, questions can be asked about the size of springers, transition health and overcrowding, length of dry period, plus several more.
Fluid milk production information is not the only number that should be benchmarked. Milk component percentages, energy-corrected milk and total pounds of solids can be tracked. These trends will help you see the direction your herd is moving regardless of the bulk tank average. Efficiency numbers such as component efficiency (total pounds of solids/DMI) milk per barn stall and milk per parlor stall per hour can also be tracked by day, week or month.
By benchmarking these efficiency numbers and trends, you are able to better understand that particular “system” of your dairy and at what point your dairy started to trend up or down. Example: I can milk a specific number of cows and, if I milk more than that, my herd starts to trend down in milk production or efficiency.
The fact of the matter is: We all have information in front of us, and we need to understand the data as thoroughly as we can. Management or nutritional decisions can be greatly affected by truly understanding how seasonal effects, herd dynamics and recent nutritional changes have and will affect your herd. ![]()

-
Tim Kinches
- Technical Services Specialist
- Form-A-Feed
- Email Tim Kinches

