
In its simplest form, a selection index is a way to determine the total economic merit of an animal based on its predicted breeding merits. Selecting the correct traits of economic value and their proper relative weightings will result in maximizing the rate of genetic improvement for total economic merit.
Understanding custom index popularity
Why have custom indexes become popular? First, creating a custom index is relatively easy and has become a commonplace offering of most A.I. companies.
Second, producers can make their custom index as simple or complex as they would like. With the ever-increasing number of genetic traits available, it can seem overwhelming at times. Thus, creating a custom index may appear to keep sire selection simplistic and more focused toward the dairy’s needs.
This leads to what may be most appealing about a custom index: It can be specific and personal to the individual farm. It allows a producer to build a selection index specific to the farm’s management needs and milk market. Hence, it puts more emphasis on traits of importance to the dairy and less (or no emphasis) on traits that do not have value to the farm.
Are custom indexes an accurate way to achieve faster genetic progress and herd profitability? In an interview with Paul VanRaden published in the August 2018 Council on Dairy Cattle Breeding Connection, he states, “Producers may believe genetic progress should be fastest if selection focuses on one or few traits. However, because many traits affect profitability, total profit usually increases when more traits are included in the selection index if the evaluations are accurate and correct economic values are used.”
To build upon this, it’s been noted in other publications custom indexes may result in over- or underestimating the value of a specific trait and ignoring the impact trait correlations have on genetic progress. The remainder of this article tackles these concepts and illustrates the unintended consequences custom indexes may have if not derived properly.
Trait correlations and genetic progress
The relationships (i.e., correlations) between genetic traits can be easily overlooked when creating a custom index. Over time, this can have a significant impact on genetic progress in the herd. To illustrate this point, a spreadsheet was created using the individual trait correlations and formula for genetic progress published in the August 2018 revision of NM$. The spreadsheet can predict the expected genetic trait correlation response and progress when altering the percent emphasis on each trait.
With that said, it’s time to create a custom index. For this example, assume a dairy is in a protein market for milk and wants to put a large emphasis on Predicted Transmitting Ability (PTA) pounds of protein and only a small emphasis on PTA pounds of fat. The dairy is also interested in health traits, emphasizing Daughter Pregnancy Rate (DPR) and Productive Life (PL). Based on this, the dairy’s custom index is weighted 60 percent protein, 10 percent fat, 20 percent PL and 10 percent DPR. This custom index is simple and only emphasizes the traits deemed important to the dairy.
Table 1 shows a comparison of this custom (Cust$) index to NM$ for relative trait weightings, trait correlations and expected genetic progress. The highlighted cells indicate which index had the advantage for genetic progress in each trait over a five-year period.
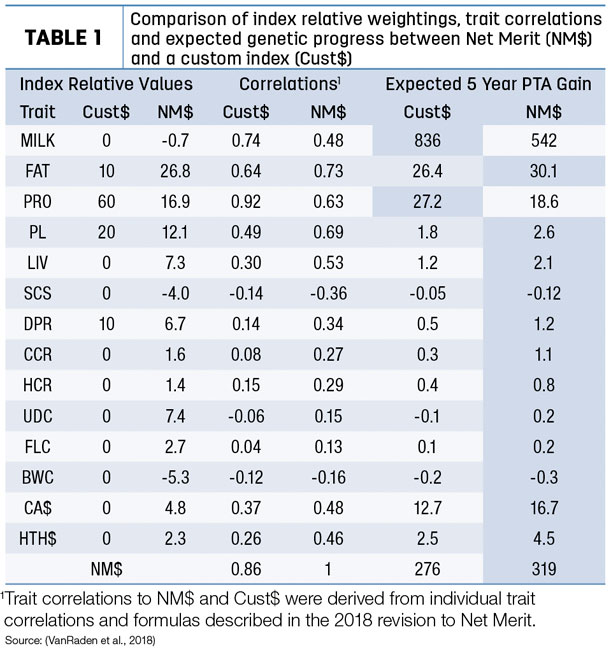
Table 1 confirms the Cust$ index will result in greater genetic progress on PTA pounds of protein in comparison to NM$. However, also interesting is the expected decrease in genetic progress for DPR and PL compared to NM$. Keep in mind, the Cust$ index has higher weightings on both traits. This is a result of not considering the relationships DPR and PL have with the other traits in NM$. (Visit the USDA ARS website for more on trait correlations.) By not selecting on the other traits correlated with DPR and PL, there is a reduction in their expected genetic progress.
Verifying the prediction
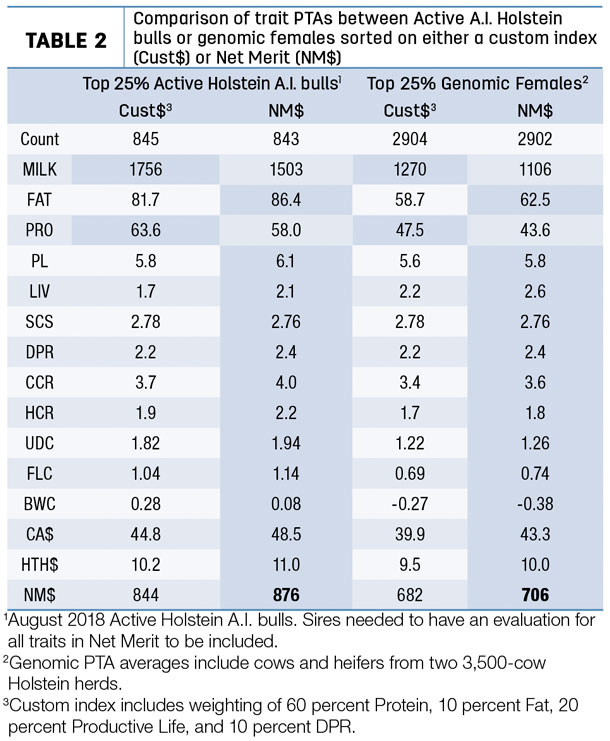
Table 1 illustrates the predicted genetic progress between NM$ and the Cust$ index. The next step is to see if similar results are observed when comparing actual A.I. bulls and genomic females. To demonstrate this, the active A.I. Holstein bull population from August 2018 was ranked on NM$ and the Cust$ index and subsequently quartiled from the top 25 percent to the bottom 25 percent for each index. Likewise, genomic-tested females from two large Holstein dairies were pooled together, ranked on NM$ and the Cust$ index and quartiled as well. The top quartile for each population was compared to see the difference in expected trait PTAs between NM$ and the Cust$ index. Table 2 includes these comparisons and shows the same outcome as previously predicted.
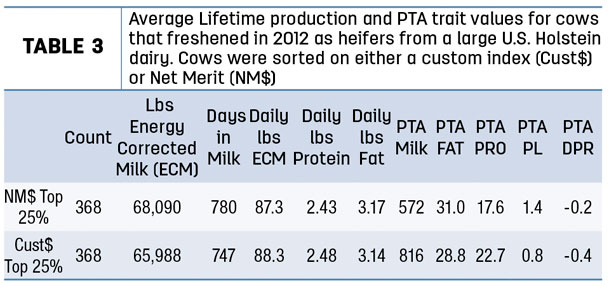
This example can be taken one step further to see the phenotypic response from the Cust$ and NM$ indexes in an actual herd setting. A retrospective analysis was done on about 1,500 Holsteins that freshened as heifers in 2012 on a U.S. dairy. Parent Averages were used to calculate the Cust$ index and NM$ values for each female. The formula of: Parent Average = (1/2 x PTA Sire ID) + (1/4 x PTA Maternal Grandsire) + (1/8 x PTA Maternal Great Grandsire) was used. These females were ranked and quartiled on NM$ and the Cust$ index.
Table 3 shows the lifetime production and genetic trait values when comparing the top 25 percent of females for each index. The impact on average lifetime days in milk is intriguing, with 33 fewer days for the Cust$ index.
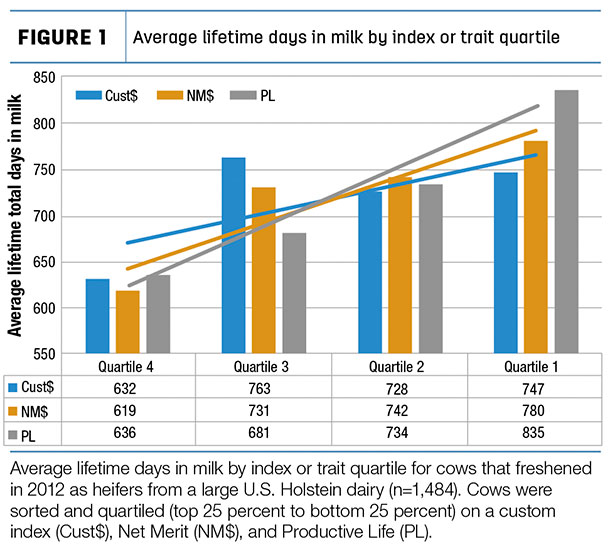
When comparing all quartiles for both indexes, greater differentiation is seen between the indexes for average lifetime days in milk. This is illustrated by the NM$ linear trend line in Figure 1 having greater separation from the Cust$ index trend line, indicating a better selection response for average lifetime days in milk. Figure 1 includes the same group of females quartiled by PL for comparison.
Final thoughts and considerations
Ultimately, custom indexes should be approached with caution. It is possible for a farm to derive a custom selection index that better meets its needs than standard selection indexes. However, a clear understanding of the expected outcomes should be determined prior to implementation.
With a desire to have simple sire selection or simple female sorting, one possible solution is the creation of a national selection index that has economic-based sub-indexes based on herd breeding objectives. It would be much easier to select on a single sub-index that emphasizes an area of farm management than it would be to select on the many traits that may be associated with it. Also keep in mind, NM$ already has two economic sub-indexes with Calving Ability and Health Dollars (values not currently published). Perhaps a future version of NM$ will go entirely to economic-based sub-indexes. This would allow producers to keep sire selection and female sorting simple, based on herd breeding objectives and not compromise the overall genetic progress of their herd. ![]()

-
Joe Binversie
- Value Added Programs Manager
- Genex
References omitted but are available upon request. Click here to email an editor.