
As a consultant at a commercial testing laboratory, this is one of the most common questions I receive from producers looking at their forage report. Most often, the question is posed when there is a major difference between the relative feed value (RFV) and relative forage quality (RFQ), which ultimately leads to conflict and difficulty determining a forage’s market value. The difference of a few points on the forage quality index can make a huge difference in pricing that hay – not surprisingly, sellers often want to point toward the higher index value while buyers put more stock in the lower value.

Understanding the equations
First, let’s examine the two equations:
RFV = (DMI × DDM)/1.29
Where:
DMI = dry matter intake = 120 / NDF
DDM = digestible dry matter = 88.9 - (0.779 × ADF)
Notice, the only constituents directly measured from the forage report in this index are acid detergent fiber (ADF) and neutral detergent fiber (NDF).
RFQ = (TDN × DMI) / 1.29
Where:
Total digestible nutrients (TDN) is different for legume or grass hay.
Legume TDN = (NFC × 0.98) + (CP × 0.93) + (FA × 0.97 × 2.25) + (NDFn * (NDFD/100) – 7
Grass TDN = (NFC × 0.98) + (CP × 0.87) + (FA × 0.97 × 2.25) + (NDFn*(22.7 + 0.664 × NDFD)/100) – 10
Notice, there are many more constituents utilized in this index: non-fiber carbohydrates (NFC), crude protein (CP), fatty acids (FA), nitrogen-free NDF (NDFn), 48-hour in vitro NDF digestibility (NDFD).
Dry matter intake is also different depending on if the hay is alfalfa or grass.
Legume DMI = 120/NDF +(((NDFD – 45) × 0.374) / (1350 × 100))
Grass DMI = -2.318 + (0.442 × CP) – (0.0100 × CP2) – (0.0638 × TDN) + (0.000922 × TDN2) +
(0.180 × ADF) – (0.00196 × ADF2) – (0.00529 × CP × ADF)
So since RFV only considers two components of the forage and RFQ takes into account up to six, it is impressive the two indexes align closely as often as they do. Also, with two different equations for legume and grass hay, this partially explains why we see these differences more often in grass hay than legume hay.
What difference between RFV and RFQ can be expected?
To gain a better understanding of what is typically seen in the lab, we gathered records for 2021 samples of legume and grass hay analyzed by NIRS forage and feed testing consortium calibrations. We filtered these samples by dry matter to ensure only hay samples were included. Figure 1 shows several panels to help us understand what is typically seen in the lab.
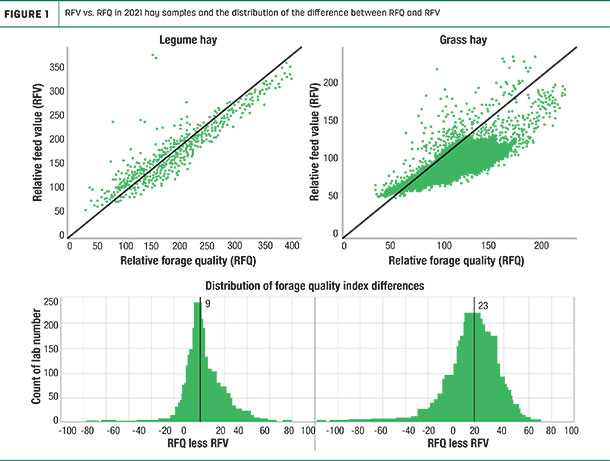
The top two panels show scatter plots RFV on the x-axis and RFQ on the y-axis with a 45º reference line. Samples that fall on the reference line have equal RFV and RFQ values. The farther samples are from the reference line, the larger the difference between the two index values. The top left panel shows RFV and RFQ values for legume hay are typically similar. As a report reviewer, I often do see alfalfa hay samples where RFV is equal to RFQ. In fact, approximately half of the legume samples displayed on Figure 1 have a difference in RFV and RFQ of plus or minus 10 or less.
Conversely, grass hay has an average difference in RFV and RFQ of 22 points, nearly double the average of legume hay. As you can see in the upper right panel of Figure 1, RFQ is typically greater than RFV. Samples to the right of the reference line have a higher RFQ than RFV. Furthermore, the scatter plot shows that as RFQ increases, the likelihood that RFV equals RFQ diminishes. So the difference between the two indices will be greater in higher-quality grass hay. This is often attributed to RFQ including fiber digestibility into the index.
While this metric is less impactful when examining legume forages which are already less fibrous and more highly digestible overall, on grass hay samples the digestibility of the fibrous portion of the plant can make a big difference in animal performance. Comparing the legume hay and grass hay distributions of RFQ less RFV (bottom of Figure 1), it is clear grass hay is more likely to have a larger difference between the two indexes. Furthermore, it would be reasonable to expect a difference up to 50 points.
Which index to use
It is key to remember what the purpose of these indexes actually is. If you are feeding livestock, your nutritionist will be balancing the ration based on protein, TDN and other nutritional factors. They will not be using either index. I always encourage livestock producers to consider the raw values on the report and how each will impact their feeding plan. RFV and RFQ are meant to be quick indicators of how one forage compares to others. Using this perspective, RFV and RFQ become less important to the end user. However, they are still important for fair hay transactions. Professionals typically advise forage and livestock producers to utilize the RFQ value when there are significant differences in the two index values. Since more nutrients are considered in the RFQ equations, and specifically the fiber digestibility is included, it is considered a more accurate reflection of the hay’s actual value.
In conclusion, while large differences in RFV and RFQ may be a point of contention and frustration in hay transactions, it should be expected that these indexes have differing results. First, they are both the result of very different equations. RFV is only based on ADF and NDF while RFQ is based on NFC, protein, FA, NDF, NDFD and ADF. These differences will be more severe and prevalent in grass hay than legume hay. Finally, when in doubt, utilize RFQ because it is a more accurate reflection of forage quality in terms of animal performance.


