


Udder health is impacted by multiple factors but can be grouped into three general categories: milkers, cows and equipment. Of these three, the equipment is by far the easiest to control. After the equipment is functioning correctly, milkers can perform their duties more effectively. Properly functioning equipment encourages milkers to do their best because they can readily observe the results of their work with more comfortable cows, less mastitis and higher production.
The importance of graphing pulsators
Pulsators are the heart of milking systems. Properly functioning pulsators are essential to udder health, cow comfort and production. With that in mind, most dairies employ a maintenance program for their milking equipment that includes pulsator graphing. This is usually performed by local dairy equipment companies on a monthly schedule. Graphing pulsators can be divided into two essential parts: the process of graphing pulsators correctly and the interpretation of the results of those graphs.
I know of no person who enjoys graphing pulsators – it is time0-consuming and tedious. If performed correctly, the work is located in a dirty and hectic environment. As a result, many technicians have adopted shortcuts that subvert the accuracy of the task. It is common for pulsators to be graphed with the claws hanging at idle. Even more common in many modern barns is to see pulsators graphed in the basement, 8 to 10 feet away from the cows. Having graphed many barns immediately following a regular equipment technician, in some cases I have identified up to 40% of pulsators that were faulty. This happens when technicians ignore the guidelines published by the National Mastitis Council (NMC) and results in pulsator problems being either ignored or undetected.
How to properly graph pulsators
NMC guidelines, as elucidated in the publication "Procedures for Evaluating Vacuum Levels and Air Flow in Milking Systems,” were first published in 1996, updated in 2004 and again in 2012. They were developed based on the standards from the American National Standards Institute (ANSI), the American Society of Agricultural and Biological Engineers (ASABE), as well as the International Organization for Standardization (ISO). The NMC guidelines describe proper graphing technique with two acceptable protocols.
-
Dry test of pulsators – This test describes the use of a properly sized T-piece inserted into the short pulse tube attached close to the inflation shell. Graphing is accomplished with the pulsators operating, liners fitted with standardized teat-cup plugs and vacuum applied to the claw.
- Milking time pulsation test – This test uses the same mechanical setup, but graphing is performed while the machine is attached to cows under full milking load.
The fundamental principle in both cases is to measure, as nearly as possible, what happens at the end of the teat. There are no other accepted ways to accurately graph pulsators. Any deviation from recommended procedures will not accurately measure the daily function of the pulsation system. When dairy owners or managers observe pulsator graphing, they need to insist that graphs be done according to the NMC guidelines.
Some newer installations have automated pulsation monitoring systems that measure each pulsation cycle every time the cow is milked. These systems measure pulsation at the pulsator, and therefore, pulsators need to periodically be manually graphed to accurately evaluate the information gathered by the system and how it relates to what the cow experiences. In addition, proper attention needs to be given to the alarm parameters so that accurate notifications are provided to dairy management.
Graphing pulsators on a regular basis ensures there is some level of consistency across all machines in the barn, as described by the NMC publication. In addition, those guidelines also recommend some minimum levels for the B (milking) phase and D (resting) phase of the pulsation cycle. Once the pulsator graphs are completed, then the interpretation of the results is required.
Interpreting results
Interpretation of pulsator graphs should be divided into two parts to answer two essential questions: Is the pulsation system mechanically sound, and is the pulsation system biologically sound? This is what I call "enhanced evaluation of pulsator graphs," and the guidelines I have developed differ from those published by NMC or other standards organizations.
Pulsator graphs return values for each phase duration as well as pulsation vacuum, pulsator rate and pulsator ratio. The phase durations reported in pulsator graphs can be expressed as either a percentage of the pulsation cycle or milliseconds. The use of percentage is not acceptable for enhanced evaluation, particularly when the pulsation rate is different than 60 cycles per minute. Therefore, phase durations expressed in milliseconds is the most valid measure used for evaluation.
Acceptable tolerance limits for the duration of each phase can be calculated as a deviation from the barn average for each phase. The tolerance limits for A Phase, C Phase, and D Phase are plus or minus 10% from the average for all pulsators. The tolerance limit for B Phase duration is plus or minus 5% from the average for all pulsators.
After phase durations are analyzed, the pulsator vacuum is evaluated. Tolerance limits for vacuum are plus or minus 0.2 inch of vacuum (0.68 kilopascal – kPa) from the average for all pulsators. When pulsator vacuum exceeds the barn average by more than 0.2 inch, this is often a reflection of system vacuum regulation and is not usually related to pulsator faults. However, when the pulsator vacuum fails to reach the barn average by 0.2 inch or more, this usually is caused by air leaks somewhere in the pulsation system.
Pulsators found to be outside of these tolerance limits are flagged for examination and repair. When pulsator graphs show that all pulsators in a barn conform to these tolerance limits, the pulsation system is said to be mechanically sound. There is some variation between pulsator systems, but all systems will meet these standards if they are properly maintained and properly graphed.
A pulsation system may be mechanically sound as proven by pulsator graphs properly performed, but pulsation can still be detrimental to udder health and cow comfort if it is not biologically sound. This means that if the milk and rest phases are not properly balanced to adequately relieve teat end congestion and edema during each pulsation cycle, then cows may suffer.
 Infographic by Corey Lewis.
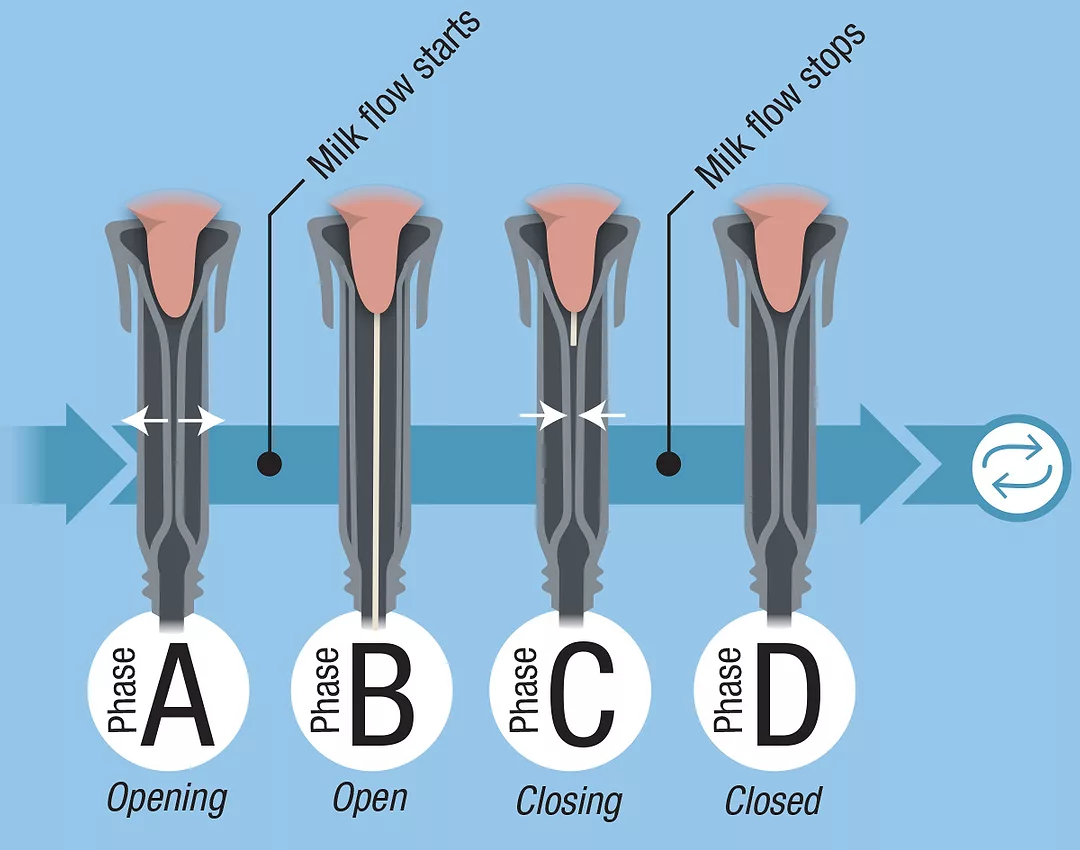
It is an inevitable consequence of milking that the B phase of the pulsation cycle creates congestion and edema (swelling) of the teat end. If vacuum is continuously applied to the teat end without relief, the teat end and teat canal swell and milk flow ceases. This is the reason for the two-chambered teat cup that alternately applies vacuum and compression to the teat end. The compression, or rest phase of the cycle, is necessary to relieve teat end swelling, which is created during the vacuum phase of the pulsation cycle.
I find NMC guidelines provide little help in determining the required D phase duration in relation to the B phase duration, only stipulating that the D phase should be at least 150 milliseconds. To address this issue, I developed a graph and formula (Figure 1) that can be used to calculate the required D phase duration for any B phase, which will adequately relieve teat end congestion and maintain milking speed, udder health and cow comfort. This formula assumes there is a linear relationship between B phase duration and the required D phase. Observations of 354 graph datasets from 141 barns over the past 10 years have confirmed that this formula provides adequate D phase duration.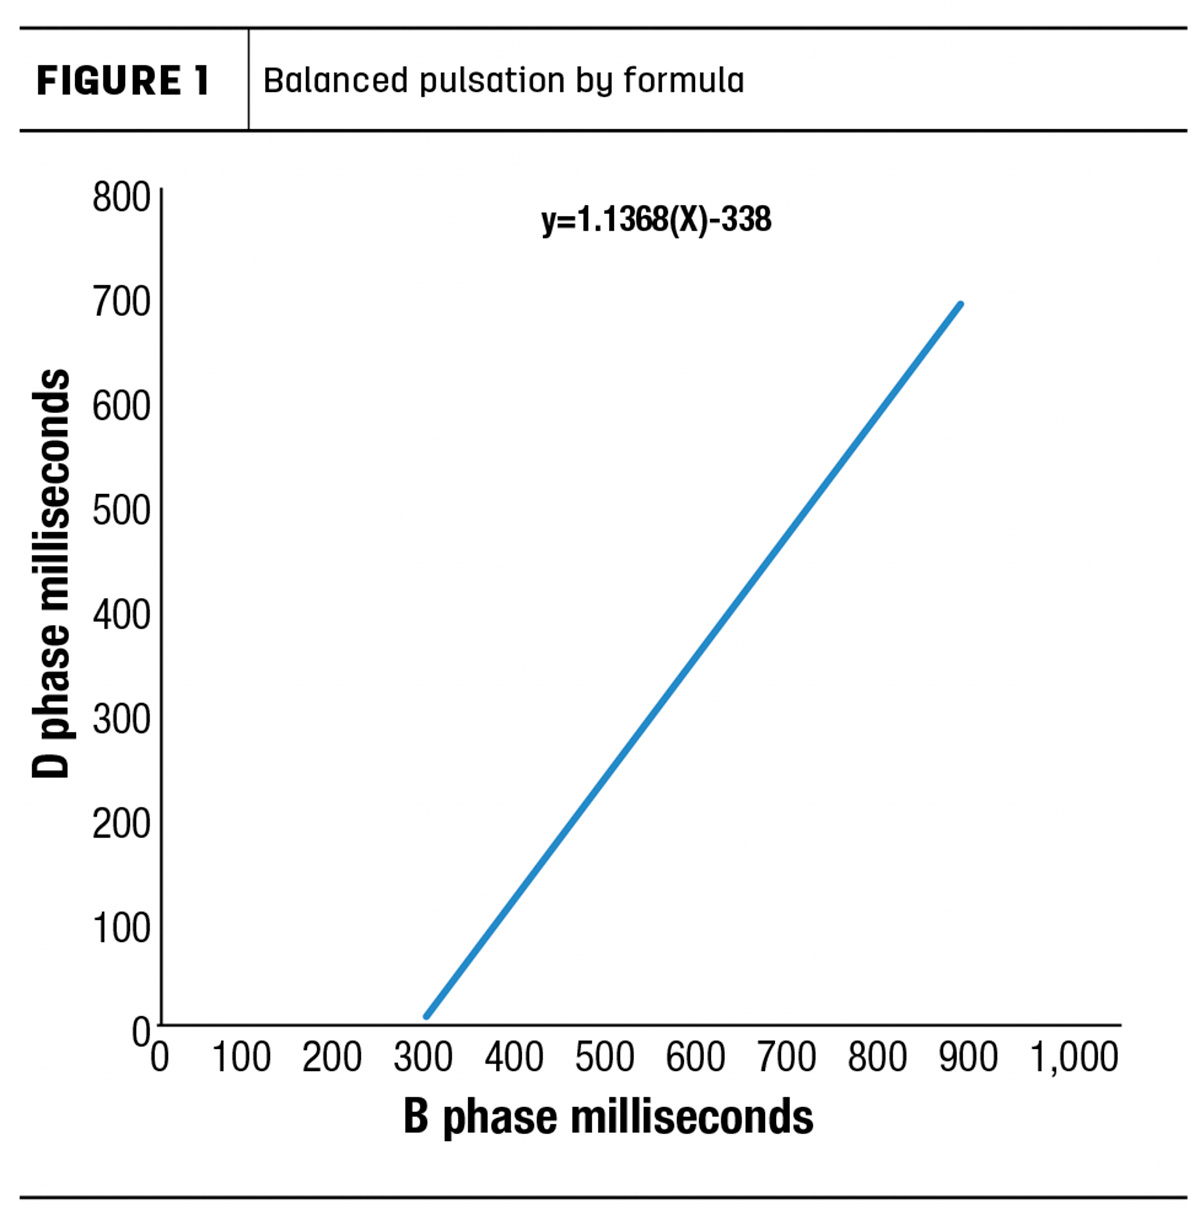 Consequences of a malfunctioning pulsator
Unbalanced pulsation is defined as occurring when teat end swelling created by the B phase of the pulsation cycle is not completely relieved by the D phase. As a result, the following cascade of events occurs. Since each pulsation cycle fails to completely relieve teat end swelling, that swelling accumulates as milking progresses. As the swelling increases, milk flow rate declines and may stop completely before the cow is fully milked out. In barns with detachers, a significant amount of milk remains unharvested and "walks out of the barn." Daily and lactational yield will be reduced over time as a result, and butterfat percentage may also be reduced because the highest-fat milk is harvested at the end of milking. When teat end swelling is increased, it prevents the teat canal from closing at the end of milking, which is a risk to udder health between milkings, and a common symptom is milk drops hanging on the teat ends after the machine is removed. In addition, as teat end swelling increases over the duration of each milking, cow comfort is impaired and expressed by treading, kicking and excessive kickoffs. Kickoffs are a risk to udder health and substantially increase milker workload and frustration.
Fortunately, achieving pulsation phases that are biologically sound is relatively easy since all pulsation controllers have options for changing pulsation rates and ratios. While it is not always possible to change pulsation parameters at the controller to exactly match the results of the formula, it is always preferable to set the rate and ratio to achieve a D phase duration equal to or exceeding the calculated requirement. It is then necessary to re-graph a random selection of pulsators to confirm that the desired results have been achieved.
The bottom line
Pulsation is a fundamental and essential component of milking systems. As such, the pulsation system must be correctly designed and maintained. Pulsators accurately tested on a regular basis, confirmed to be mechanically sound and adjusted to be biologically sound, provide safe and effective milking for every cow each time it is milked.

