


Feeding a low dietary cation anion difference (DCAD) diet is a common strategy to “acidify” pre-fresh cows to minimize the risk of milk fever. Anionic supplements “acidify” diets and deliver negatively charged chloride and/or sulfur ions, enhancing calcium metabolism in the transition period. Improved calcium metabolism can help increase dry matter intake (DMI) and milk production post-calving.

On-farm case study
After seeing several large herds in the area feed a liquid molasses-based DCAD product, a large dairy herd in the Midwest decided to try the same strategy for their pre-fresh feeding program. This farm had persistent high milk fever cases, and on the first week of February 2022, they switched from a commercial dry DCAD product to a liquid molasses-based DCAD product.
A well-distributed TMR in the feedbunk is the key to consistent intake and performance. In order to evaluate TMR mixing consistency, I took two TMR samples a week after the farm started the molasses-based liquid DCAD product. As shown in Table 1, the two samples showed substantial nutrient variations, likely due to poor TMR mixing and/or distribution. It seems that one sample had more forages and another sample had more grain mix, due to the differences shown in dry matter (DM), protein, NDF, starch, calcium, phosphorus and magnesium levels.
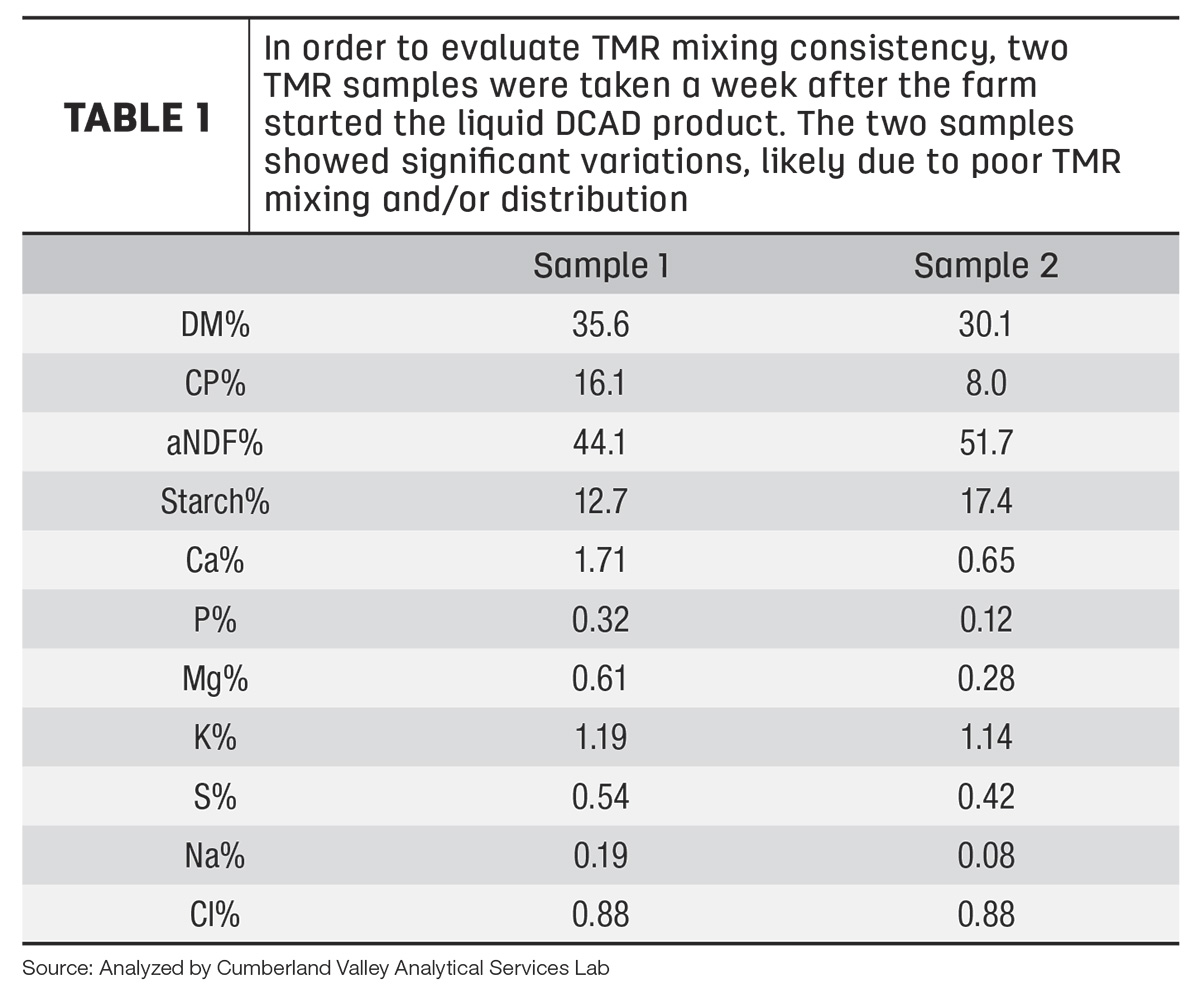
One interesting observation is that despite the huge nutrient variations, the levels of dietary DCAD of these two TMR samples reported by Cumberland Valley Analytical Services (CVAS) analysis reports are very similar. Sample 1 is at -19.5 meq per 100 grams DM, and sample 2 is at -18.1 meq per 100 grams DM. Is this just a coincidence? Well, how is the DCAD calculated? DCAD represents dietary cation-anion difference. It is typically calculated as the difference of two cations, potassium (K) and sodium (Na); and two anions, chlorine (Cl) and sulfur (S).
DCAD calculation equation: DCAD = (Na + K) – (Cl + S)
Sodium and potassium are naturally from forages, not being added in the dry mineral mix. Chlorine and sulfur are provided from the liquid DCAD. As shown in Table 1, sample 1 had 0.88% chlorine and 0.54% sulfur, and sample 2 had 0.88% chlorine and 0.42% sulfur. Despite huge variations of the two samples, likely due to poor mixing of forages and grain mix, liquid DCAD product sticks to forages, and the two nutrients provided by liquid product (chlorine and sulfur) are still very consistent in TMR, making the dietary level of DCAD similar between the two samples. This is a story where two “bad TMR samples” actually demonstrated the advantage of the liquid DCAD product in TMR distribution. Although the DCAD was similar for the two samples, the large variations in protein, fiber and DM could lead to inconsistent rumen fermentation and DMI, so it was very important to improve the overall consistency of mixing immediately.
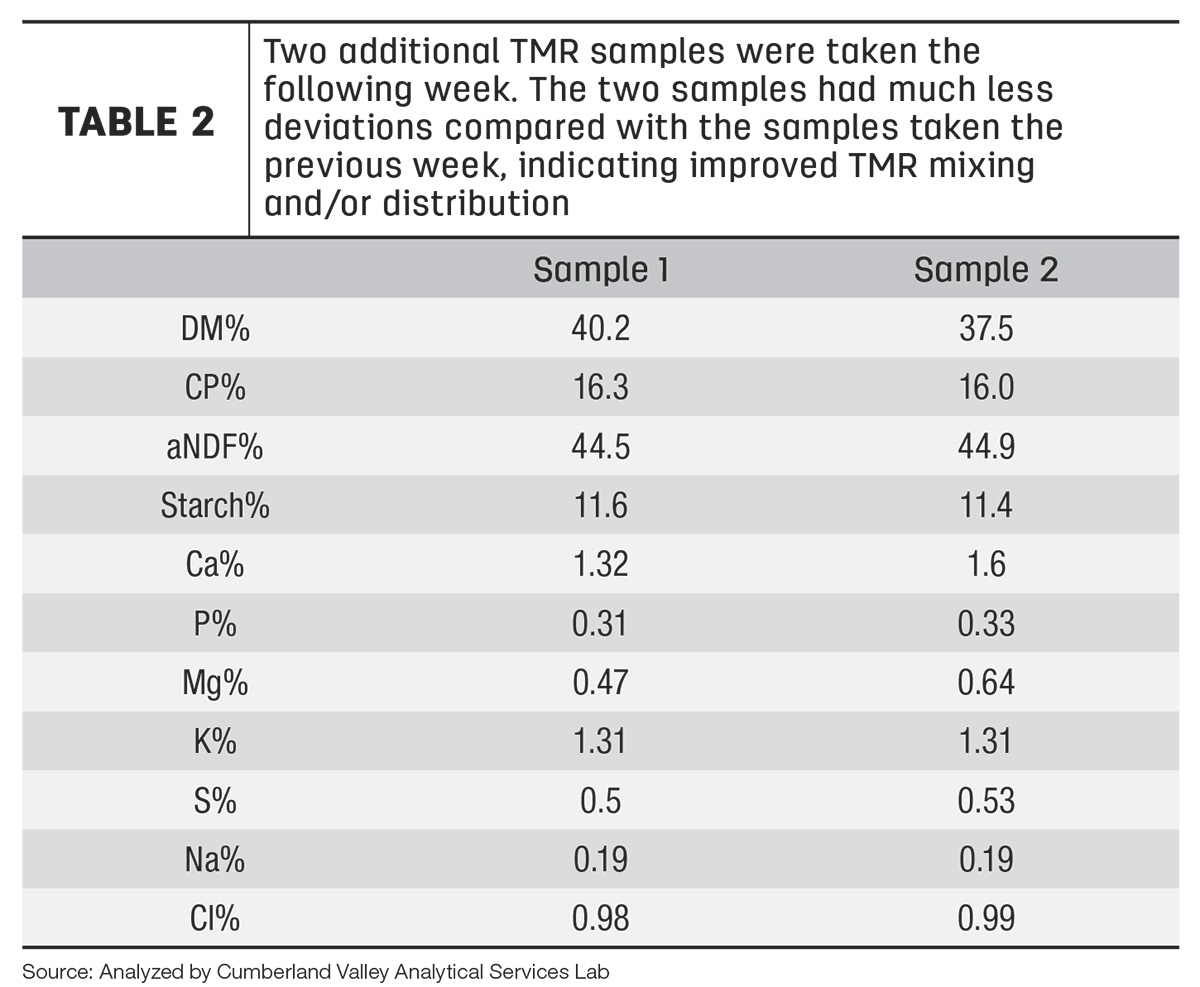
After addressing the issues of TMR mixing and distribution to the farm manager and feeder, I took two additional TMR samples the following week. As shown in Table 2, the two samples had much fewer deviations compared with the samples taken the previous week, indicating improved TMR mixing and/or distribution. Again, based on CVAS analysis reports, the levels of dietary DCAD of these two TMR samples are very similar, with sample 1 at -17.2 meq per 100 grams DM, and sample 2 at -18.9 meq per 100 grams DM. Urine pH tests were extremely consistent at the level of 5.8.
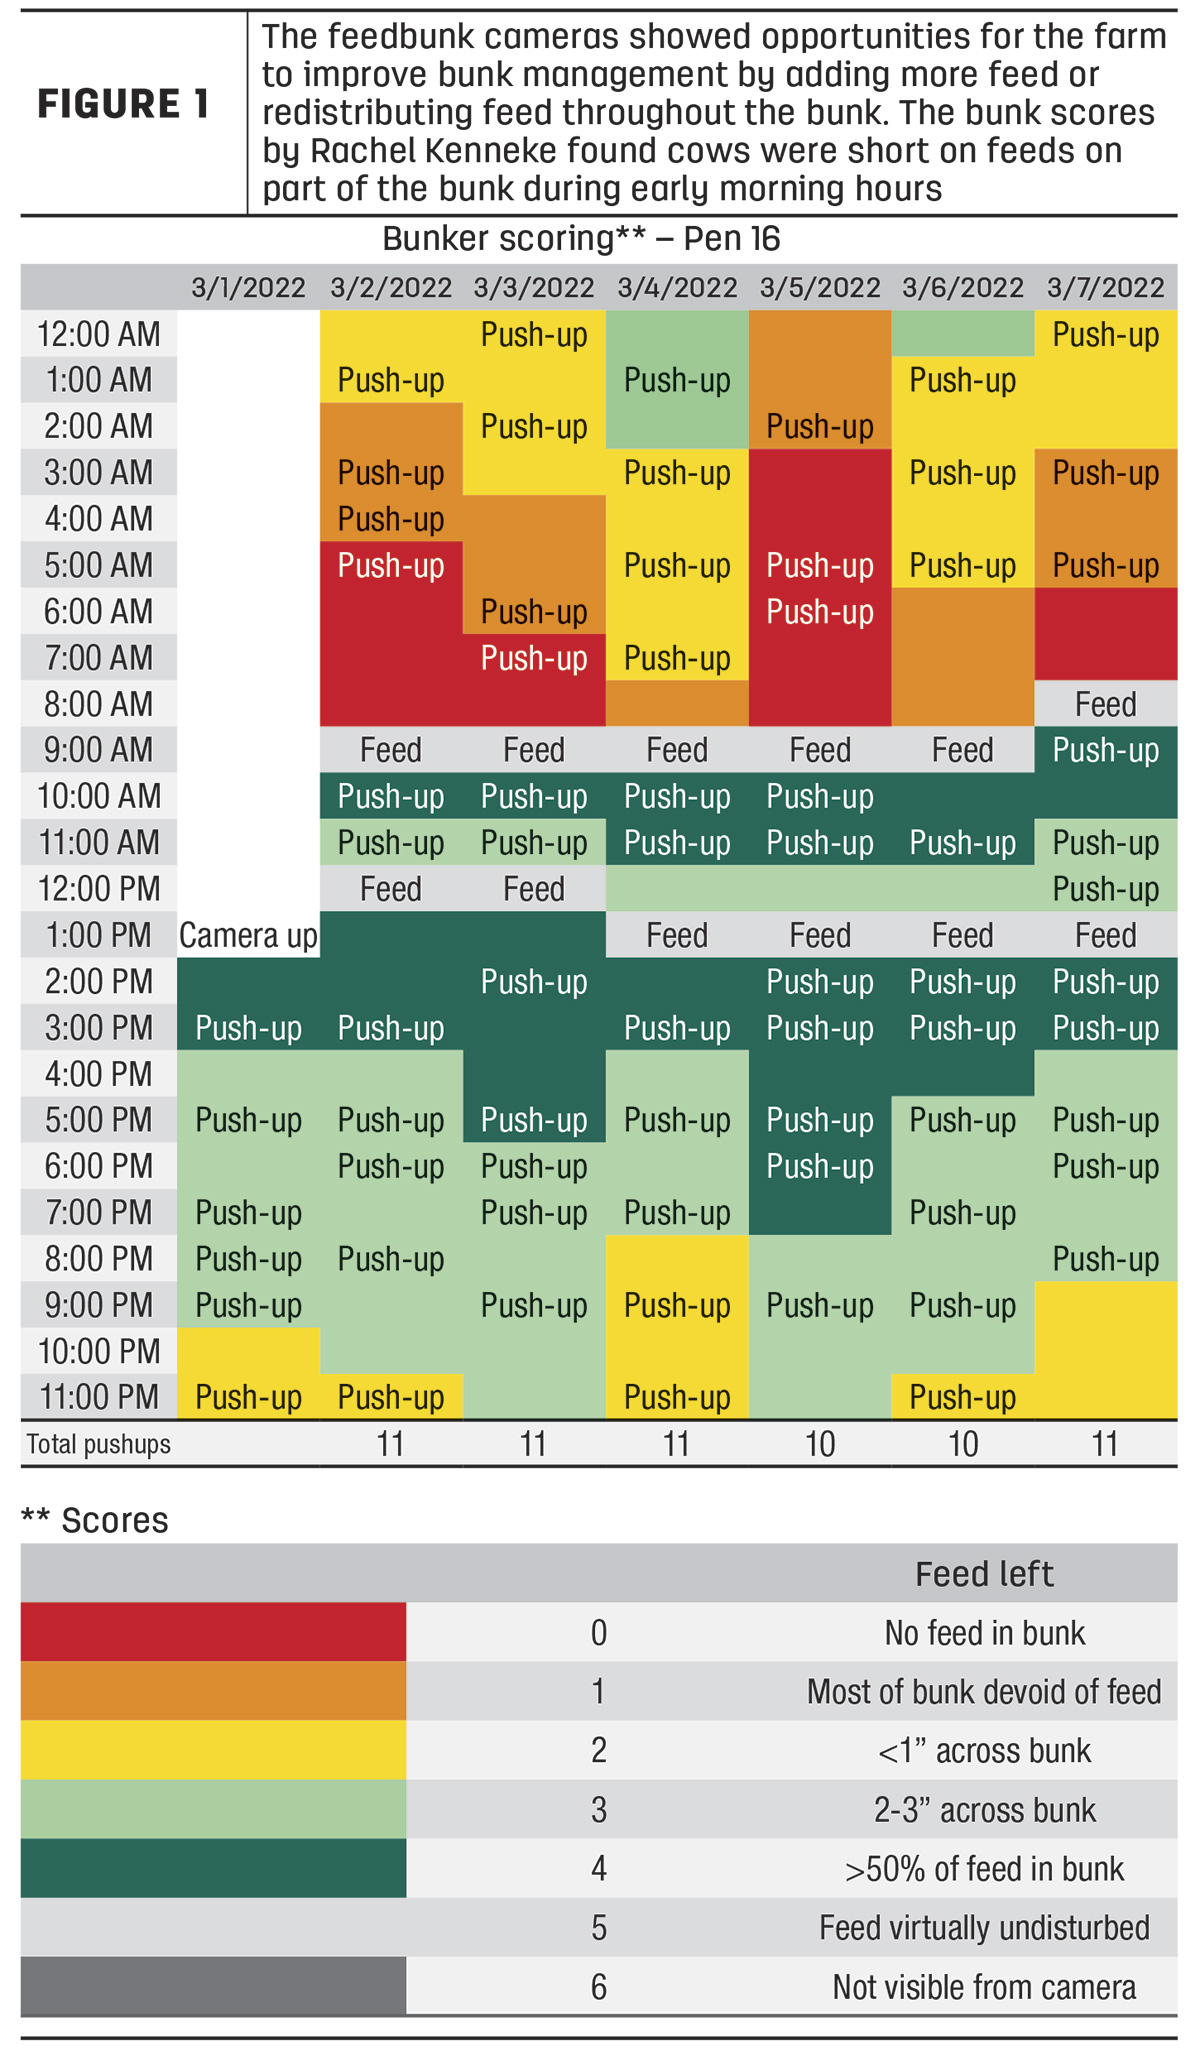
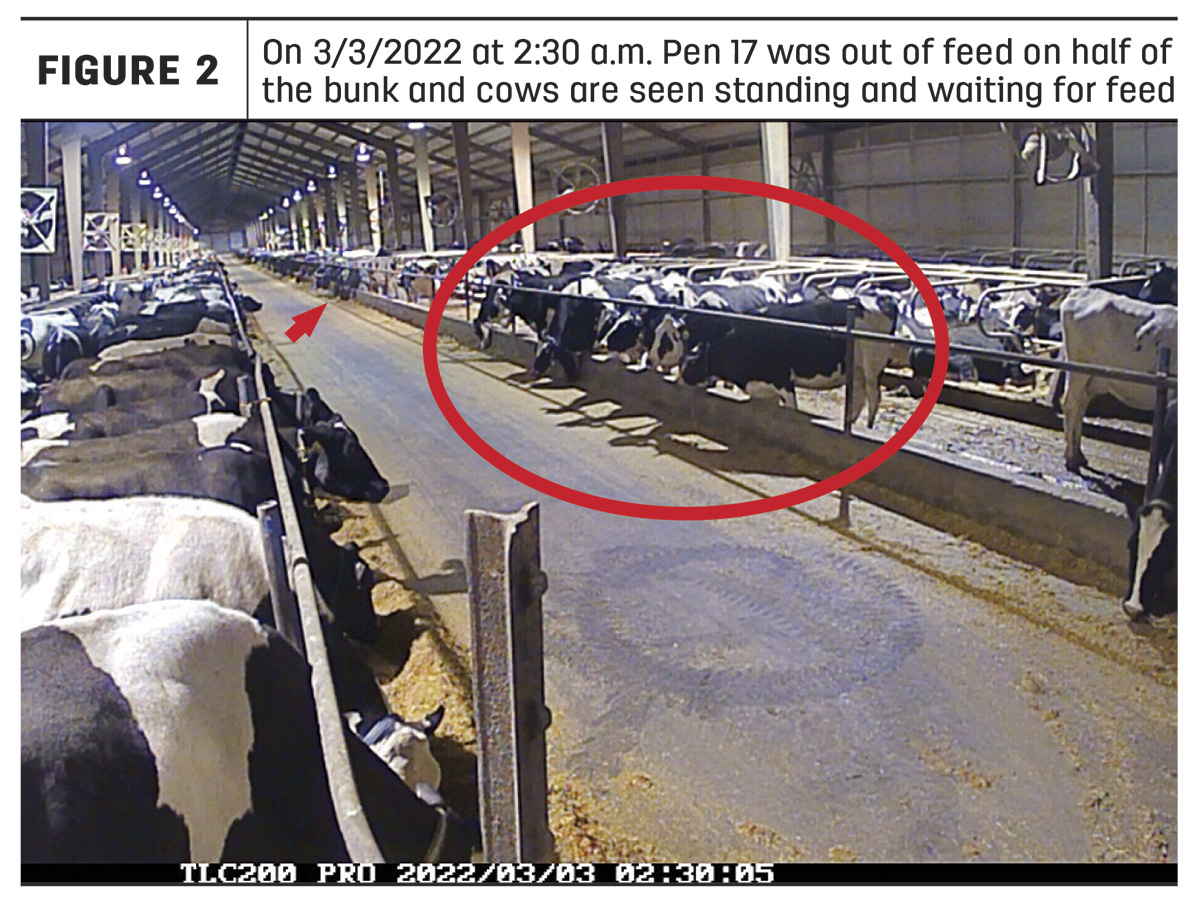
In addition to TMR mixing, another important area is feedbunk management. Without a good feeding management, cows won’t perform well. I set up feedbunk cameras on this farm to monitor feed availability and feed pushup frequency. As shown in Figure 1, this farm had feed pushups around 10 to 11 times per day, a good frequency compared with other farms. Our camera snapshots and bunk scores found cows were short on feeds on part of the bunk during early morning hours (Figures 2 and 3). The owner of this farm reviewed our feedbunk report carefully and implemented several measures to further improve feed availability and feed redistribution.

Key takeaways
- Liquid DCAD products are easy to load the required amount accurately and to distribute thoroughly in TMR. This improves efficacy and economics.
- Best findings oftentimes occur by accident. In this on-farm case study, two “bad TMR samples” that have substantial variations accidentally demonstrated the distribution benefit of molasses-based liquid DCAD product in TMR.
- If mixing and/or distribution concerns for pre-fresh TMR are found, quick corrective action and timely follow-up will help to optimize dry matter intake and TMR efficiency.
- Feedbunk camera evaluation has helped many producers improve feeding management.

