What is the best measure of feeding economics? There are a variety of ratios used in the dairy industry to evaluate feeding economics – and they are misleading or inaccurate if used inappropriately. Examples include milk price to feed price (USDA’s milk-to-feed ratio), dry matter intake to milk production (milk-to-feed) and feed cost per hundredweight (cwt).

Income over feed cost (IOFC) is the most common margin used to measure feeding economics.
Margins are nearly always preferred over ratios, although both can be misinterpreted. Understanding how these common ratios and margins are calculated and interpreted helps avoid misuse and mistakes.
Feed cost per cwt the right way
Calculated the correct way on financial statements (accrual usage of feed consumed by milking and dry cows divided by cwts of milk shipped), feed cost per cwt, a ratio, provides a long-term picture of how good of a job the dairy did in converting feed dollars to saleable cwts.
It does not include heifers but is impacted by many factors including price paid for feed, shrink, refusals, hospital, efficiency of converting feed into milk, dry cow numbers and dry period lengths.
Management factors such as reproduction, days in milk, facility design, cow comfort, milking frequency, etc. impact it as well. If feed cost per cwt on the financial statement is too high, there are many places to look for improvement.
The biggest weakness of this number is that it ignores the value of milk. It typically costs more feed to produce higher-value milk (higher components or lower SCC). Thus, it is inappropriate to compare feed cost per cwt for herds with different component levels or milk quality.
Feed cost per cwt the wrong way
Feed cost per cwt can also be calculated on a cow-by-cow basis (feed costs per day divided by milk per cow divided by 100).
This number has no useful purpose for a dairy. By accident, it may lead to correct decisions – just as often it will lead to incorrect decisions.
Income over feed cost
Income over feed cost is a margin that is calculated as (milk revenue per cow per day) minus (feed costs per cow per day). Any management or feeding change that increases IOFC is likely good, provided it does not impact cow health. IOFC is driven by several factors.
The obvious ones are feed price and milk price. Others include feed conversions, milk per cow and the value of milk (i.e. components and premiums).
Day-to-day feeding and management decisions should be evaluated using income over feed costs. Items like shrink, refusals, hospital and dry cows are not generally considered by IOFC.
Example: Consider a dairy with the following milk production numbers:
- Milking and dry cows consumed $108,000 in feed
- The dairy shipped 10,100 cwts
- Milk cow feed costs were $6.80 per day
- Tank average was 75 lbs
- Milk price was $18 per cwt
Measures of feeding economics
1 . Feed cost per cwt (the correct way that appears on financial statements)
- $108,000/10,100 = $10.80 per cwt
2. Feed cost per cwt (the wrong way; often mistakenly used to make decisions)
- $6.80/(75/100) = $9.07 per cwt
3. Income over feed cost
- (75x0.18¢) – $6.80 = $6.70 per day
Why not use feed cost per cwt the wrong way?
Suppose the dairy above changed the ration to get more milk. Suppose the ration costs increased from $6.80 per day to $7.05 per day and milk increased from 75 to 77 lbs.
- Feed cost per cwt (the wrong way) would now be $7.05/(77/100) = $9.16 per cwt.
- Income over feed cost would now be (77x0.18) – 7.05 = $6.81 per day
Was this a good change for the dairy? Feed cost per cwt increased nine cents per cwt but IOFC increased 11 cents per day.
Feed cost per cwt suggests it was a poor decision because feed costs increased. The IOFC suggests it was a good decision because the dairy increased profit. Which is correct? Mathematically both are correct but feed cost per cwt gave the wrong answer. Of course the dairy should take the profit, provided cow health was not impacted.
Is IOFC the best measure?
Even though income over feed cost is an ideal tool to measure the impact of management and feeding decisions, it has several potential shortcomings:
- Component changes are often not factored into the equation. In the above examples, fat and protein were not considered – and they have a large economic impact.
- It is not useful to monitor change over time. If IOFC improves, does it mean that the herd improved or simply that milk price was higher or feed costs were lower?
It is impossible to differentiate, so IOFC is a poor barometer of herd performance.
Components must be considered
Milk premiums in most markets are offered for high-quality milk (low bacteria and somatic cell counts), butterfat and protein. Shipping higher-value milk is an opportunity for many dairies.
Given how most dairies are paid for their milk, it doesn’t make sense to use milk per cow as a measure of performance. For instance, most would agree that a 60-lb cow with 4.8 percent fat and 3.6 percent protein is better than a 65-lb cow with 3.5 percent fat and 2.8 percent protein.
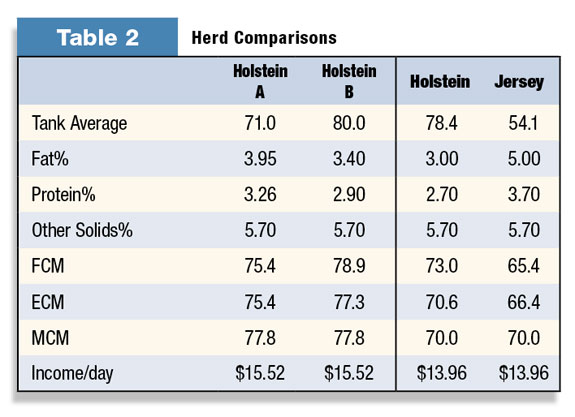
This seems obvious by looking at the raw numbers and knowing what components are worth. But what about a 71-lb herd with 3.95 percent fat and 3.26 percent protein (Herd A) compared to an 80-lb herd with 3.40 percent fat and 2.90 percent protein (Herd B)? Which is better? This comparison is not so simple.
To make comparisons more equitable, we have traditionally used fat-corrected milk (FCM) or energy-corrected milk (ECM). Both FCM and ECM are designed to relate the energy content of milk. They are strictly based on biology and have no economic basis. The formulas work the same when protein is $1 per pound or $4 per pound.
A new measure called money-corrected milk (MCM) is a revenue-based measure of cow productivity.
It considers the economic value of milk components and the impact of milk check assessments. Similar to ECM or FCM, it is expressed as pounds of milk per cow per day.
Instead of relating to the energy contained in the milk, MCM relates to the income derived from the milk produced.
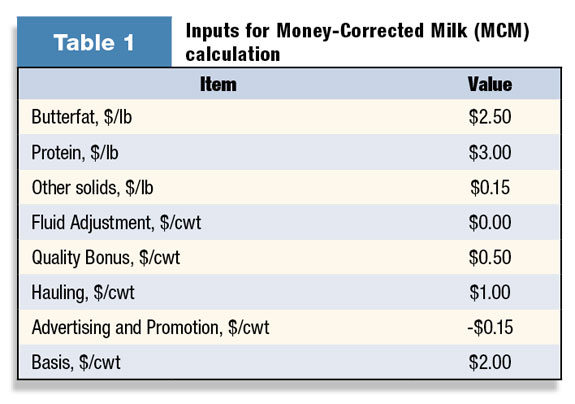
In the examples, MCM is calculated using 3.5 percent fat, 3.0 percent protein, 5.70 percent other-solids basis.
The inputs needed include all items that impact the milk check, such as value of fat and protein, quality premiums, hauling and other assessments.
So which is better, the 71-lb cow with high components or the 80-lb cow with low components? If tank average is the measure, as it normally is, Herd B is obviously better. Herd B is also better if FCM or ECM is the measure. If the measure is MCM, the herds are exactly the same. The MCM is directly related to income per cow per day.
Money-corrected milk IOFC uses the money-corrected milk concept to provide the best measure of dairy feeding economics. The difference from traditional IOFC is twofold:
- The milk check-based approach of money-corrected milk is used to determine income
- Economic factors (feed price, component prices and milk check assessment values) are fixed over time.
By using the money-corrected milk concept, components and all milk check factors are considered. By fixing prices, any change in money-corrected milk IOFC is due to changes in cow performance.
Using MCM to make herd decisions
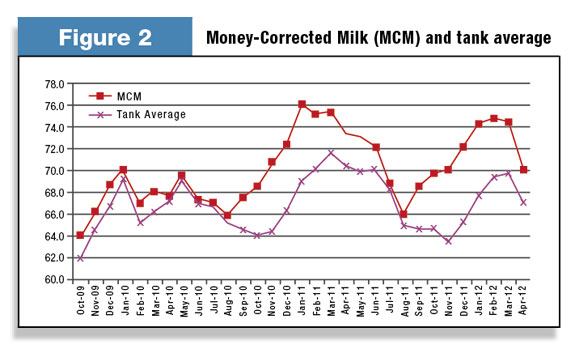
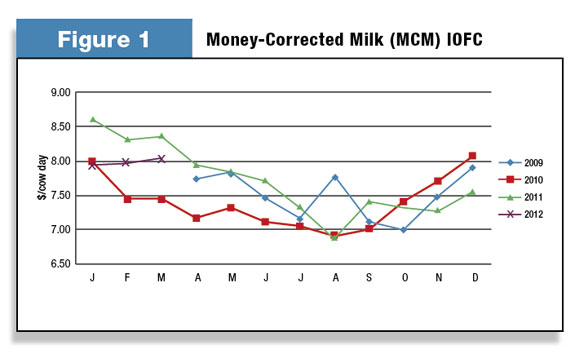
In Figure 2 , money-corrected milk and tank average are displayed for a herd over a two-year period.
This is a 2x, no-bST drylot herd in the southwestern U.S.
The prices used to compute MCM were $2.60 protein, $2.40 fat, $0.15 other solids, plus milk check adjustments.
Note that in the fall and winters of 2011 and 2012 MCM was 5 to 7 lbs higher than tank average. In the summer they were similar. Each fall, the dairy was leaning toward a ration change to boost milk, as tank average did not seem to recover as they expected.
However, the component recovery was significant and a major economic impact. The MCM chart demonstrates they really improved about 10 lbs from summer to winter; the tank average suggested a 6- to 7-pound increase.
Also, the MCM graph shows that recovery started in September; tank average suggested December. Using MCM allowed the herd to stay dialed in to the economic performance of their cows.
Summary
There are many measures of feeding economics used in the dairy industry. In general, margins matter and ratios don’t when it comes to feeding economics. PD

-
Greg Bethard
- G&R Dairy Consulting
- Email Greg Bethard