


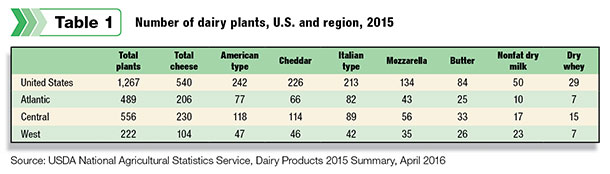
While U.S. dairy farm numbers continue to decline, the number of dairy processing plants remain constant, according to the USDA National Agricultural Statistics Service’s annual dairy products summary.

In 2015, there were 1,267 U.S. manufacturers producing one or more dairy products, down two from 2014 and just 11 fewer than 2011. During the same period, U.S. dairy farms commercially licensed to sell milk declined 15 percent, from 51,291 in 2011 to 43,584 in 2015.
 Wisconsin remained the leading home for dairy manufacturers, with 203, 127 of which produced cheese. Rounding out the top five states for total dairy plants were New York (126), California (117), Pennsylvania (80) and Ohio (66).
Dairy product summary: Cheese
Total cheese production (excluding cottage cheeses) was 11.8 billion pounds in 2015, 2.8 percent more than 2014. Among the nation’s leading cheese states, 2015 cheese production followed milk output trends.
Wisconsin remained the nation’s cheese leader, producing a record 3.07 billion pounds of total cheese in 2015, 29.5 percent of the nation’s total and up from 2.91 billion pounds in 2014. The state’s dairy herds produced 29.03 billion pounds of milk and 1.092 billion pounds of milkfat in 2015, up about 4 percent from 2014.
In contrast, California, the second-leading total cheese state, produced 2.35 billion pounds in 2015, down from 2.44 billion pounds the year before. The state’s dairy herds produced 40.9 billion pounds of milk and 1.52 billion pounds of milkfat, down about 3 percent from 2014.
Other leading total cheese-producing states were (in order): Idaho, New York, New Mexico, Minnesota and Pennsylvania.
Among cheese varieties, Wisconsin led in American-type cheese (cheddar, Colby), with California and Idaho second and third, respectively. Wisconsin was also the nation’s leader in dry whey output, at 308.6 million pounds.
Paced by mozzarella output, California topped Wisconsin in production of Italian cheeses, with 30.7 percent of the U.S. total. However, the gap closed from the previous year.
Ohio was the nation’s leader in Swiss cheese production, while California led the Hispanic cheese category.
Butter gains popularity but not much production
U.S. butter production during 2015 totaled 1.86 billion pounds. Despite making the cover of Time for its renewed popularity, production was up just 0.1 percent from 2014.
At 580.5 million pounds, California led all states in butter production, with 31.2 percent of the nation’s total. However, with less milk and milkfat available, the state’s output was down about 32 million pounds from 2014. California also led the nonfat dry milk category, at 702.1 million pounds.
Yogurt was another popular consumer choice in 2015, but production totals may surprise you. Production of plain and flavored yogurt was actually lower than 2014, at 4.72 billion pounds. Individual state data was not available.
Finally, don’t forget the ice cream. California far surpassed any other states in 2015 production of regular (hard) ice cream, at 129.1 million gallons. Pennsylvania was second, at 38.9 million gallons. PD

-
Dave Natzke
- Editor
- Progressive Dairyman
- Email Dave Natzke


