


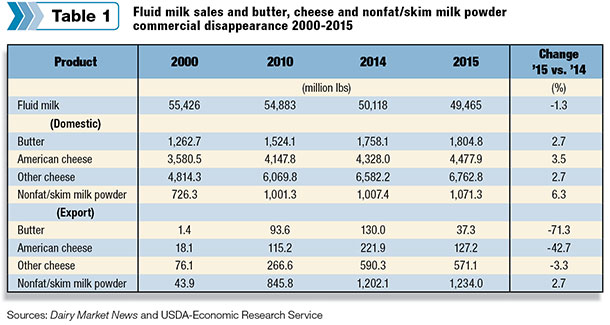
Domestic commercial disappearance of all manufactured dairy products was up in 2015. Even though fluid milk sales continued their downward trend, sales of whole milk were actually higher in 2015 compared to the previous year.

Butter and cheese exports struggled in 2015 with export volume below 2014, but nonfat/skim milk powder exports held their own (Table 1).
Let’s take a closer look at dairy product disappearance in 2015 and how it compares to previous years plus the signals consumers are sending dairy farmers through their dairy product purchases.
Fluid milk
Consumers continue to consume less dairy in the form of fluid milk, and last year was no exception. Fluid milk sales in 2015 were down 1.3 percent compared to 2014. In fact, during the past five years, total fluid milk sales have declined almost 10 percent or about 5 billion pounds.
However, there is some good news to report. Whole milk sales were up 4.6 percent in 2015 compared to 2014 (Figure 1). On the other hand, sales of reduced fat and skim milk were down 3.7 percent.
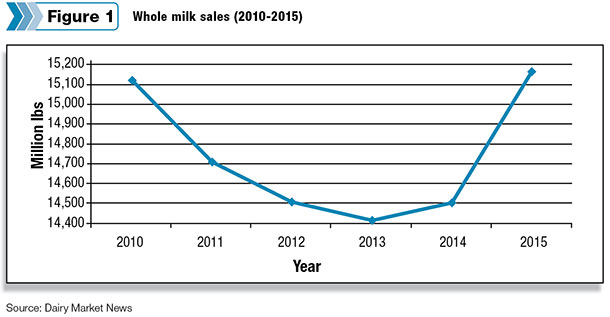
This is the third consecutive year for an increase in whole milk sales relative to sales of reduced fat and skim milk. In 2015, whole milk represented 31 percent of total fluid sales compared to 28 percent three years ago. Higher whole milk sales resulted in an additional 2 million pounds of butterfat utilized in fluid milk in 2015 versus 2014.
Before leaving fluid milk, let me mention organic milk. Organic sales were slightly lower in 2015 compared to 2014. However, the percent of total fluid milk sales which are organic increased from 3.3 percent in 2010 to almost 5 percent in 2015.
Butter
Consumers continue to show their desire for butter. Domestic disappearance of butter exceeded 1.8 billion pounds last year, an increase of 2.7 percent over 2014. Since 2010, domestic butter disappearance has increased an impressive 40 percent (Figure 2).
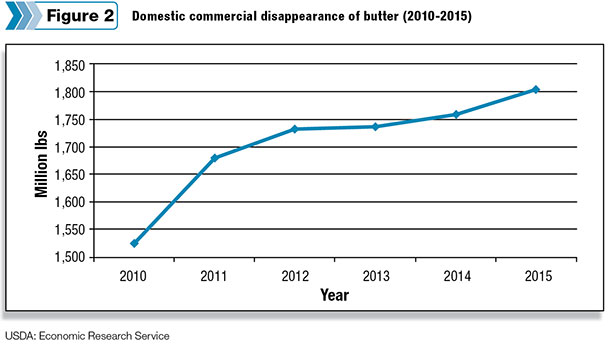 Higher whole milk sales and butter disappearance are contributing to butterfat representing a higher percent of milk’s total value relative to the skim.
Could it be that consumers realizing fat is not as bad for our health as we once were led to believe is propelling consumer demand for butter and whole milk? We will be anxious to see if this trend continues.
Last year was a down year for butter exports; 37.3 million pounds of butter were exported from the U.S. compared to 130 million pounds in 2014. A domestic price averaging more than $0.60 per pound higher than the international butter price hindered exports. In fact, the high domestic price opened the door for 41.3 million pounds of butter imports in 2015, the highest amount since 2001.
Cheese
Since 1975, commercial disappearance of cheese has increased every year (Figure 3). Total domestic cheese disappearance in 2015 was 11.24 billion pounds, which is a 3 percent increase from 2014. Compared to 2000, greater than 2.84 billion pounds more cheese was used last year.
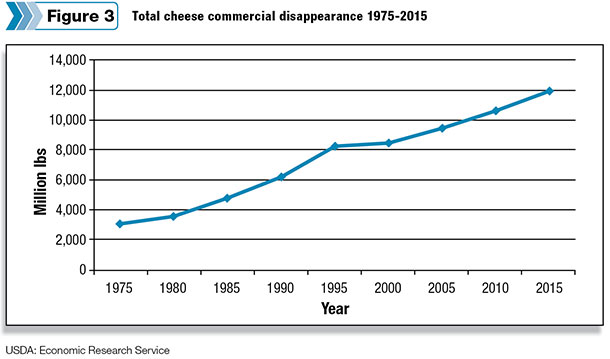
Back in 1970, less than 25 percent of the nation’s milk supply went into cheese production. Today, it is approaching 60 percent.
Looking at cheese disappearance between American (cheddar, Colby, Monterey Jack) and the other cheese category, we see the other category continues to dominate. Other cheeses now account for about 60 percent of domestic use.
Other cheese is primarily Italian, with mozzarella as the main variety. Both categories increased disappearance in 2015, but the other cheese category has shown the greatest growth since 2000, increasing more than 40 percent.
Similar to butter, American cheese exports were down significantly last year. However, exports of other cheese were only down 3.3 percent, with almost 8 percent of other cheese disappearance exported in 2015.
On the import side, cheese imports continue to account for a smaller percent of the cheese supply. Since 2000, the percent of American cheese imported declined from about 1.2 percent to 0.7 percent. And other cheese imports declined from about 6 percent to 4 percent. Imported cheese is mostly varieties not manufactured in the U.S.
Nonfat and skim milk powder
More than 2.3 billion pounds of nonfat and skim milk powder were used domestically or exported in 2015. About 80 percent of this was nonfat and 20 percent skim powder. The main difference between the two is: Skim milk powder has a minimum protein level of 34 percent, while there is no minimum protein level for nonfat. Disappearance of nonfat/skim milk powder has increased almost threefold since 2000.
Increased disappearance is due to more exports and expanded use domestically. About half of the nation’s nonfat/skim milk powder disappearance is now exported (Figure 4).
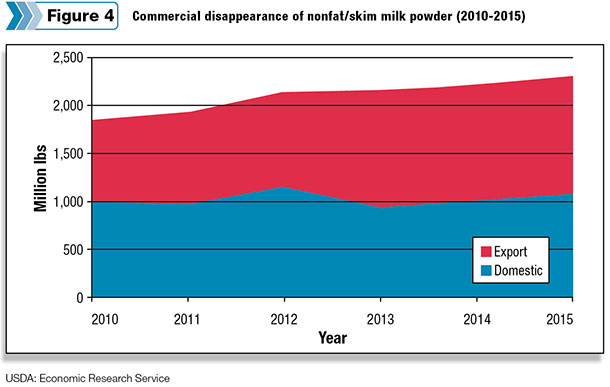 Powder exports in 2015 were up 6.3 percent in 2015 over 2014. Unfortunately, revenue from powder exports was down significantly due to the international powder price, about 40 percent lower in 2015 compared to 2014.
Domestic powder disappearance was about 6 percent higher last year. Main uses of nonfat dry milk powder domestically include standardizing milk for cheese making and as an ingredient in various food products.
Future
The numbers show 2015 was a good year for domestic dairy demand, especially cheese and butter. In spite of strong competition from other dairy exporting countries, exports of nonfat/skim powder were up last year. It was good to see at least one positive trend in fluid milk: whole milk sales increasing.
Looking to the future, I turn to the recently released report, USDA Agricultural Projections to 2025. This report is optimistic about future dairy demand. The report projects dairy demand to grow faster than population growth. Cheese sales are projected to increase as consumers eat more prepared foods and more meals away from home.
Butter consumption is projected to keep increasing as well. Exports of U.S. dairy products are projected to grow as well. The only negative projection is fluid milk consumption, which the report projects will keep declining.
Let’s hope these projections are correct, except for fluid milk. And that the increased demand will translate into improved milk prices at the farm. PD
Calvin Covington is a retired dairy cooperative CEO and now does some farming, consulting, writing and public speaking.

