


Since Jan. 1, 2000, about 85 percent of the milk regulated by Federal Milk Marketing Orders has used multiple component pricing (MCP) to pay dairy farmers. Under federal order MCP, dairy farmers are paid for their milk production based on pounds of butterfat, protein and other solids. Combining the values of these components equals the federal order Class III price.

In addition to the component payments, there is a producer price differential (PPD) paid on a hundredweight basis. The PPD includes the value of each order’s Class I and II differentials. Also, four federal orders include an adjustment for somatic cell count.
This article takes a look at the past 14 years of MCP in regards to changes in component values, components and their impact on the milk check, and dairy farmers’ responses to MCP.
Changes in milk component values
The most significant change in component values is other solids. See Figure 1. First, let me provide a refresher on what the other solids in milk are. Other solids are the components in the skim portion of milk found after subtracting protein from solids-not-fat.
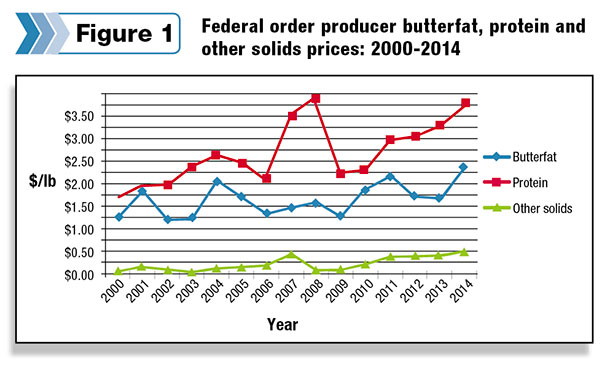
Lactose is more than 80 percent of other solids. The remainder is milk’s vitamins and minerals. The various whey products are made from other solids. The price of whey solids is used to calculate the federal order other solids price.
Back in 2000, the other solids price was only $0.05 per pound. It then declined to about a penny per pound in 2003. Due to the growth of the whey market and the accompanying increase in the whey price, the other solids price has increased significantly. In 2014, other solids averaged $0.47 per pound. To put it in better perspective, other solids contributed about $0.30 per hundredweight to the Class III price in 2000. In 2014, it was about $2.70 per hundredweight, a ninefold increase.
Since 2000, protein has exceeded the butterfat price every year. However, based on the price of butter and cheese, the amount the protein price exceeds the butterfat price has varied. Block and barrel cheddar cheese are the primary contributors to the protein price, while the price of butter sets the butterfat price per pound.
The highest annual protein price was back in 2008 at $3.89 per pound. Since the 2009 price collapse, protein has increased in value each year. Looking at butterfat, last year saw the highest butterfat price, at $2.38 per pound.
Component valuesand the milk check
Which components have the greatest impact on my milk check? This is a common question asked by dairy farmers. Table 1 helps to answer this question. This table shows each component’s share of the Class III price per hundredweight from 2000 to 2014. The Class III price is reported at 3.5 percent fat, 2.99 percent fat, 5.69 percent other solids. In addition, the protein and other solids are combined to show skim’s total share of the Class III price.
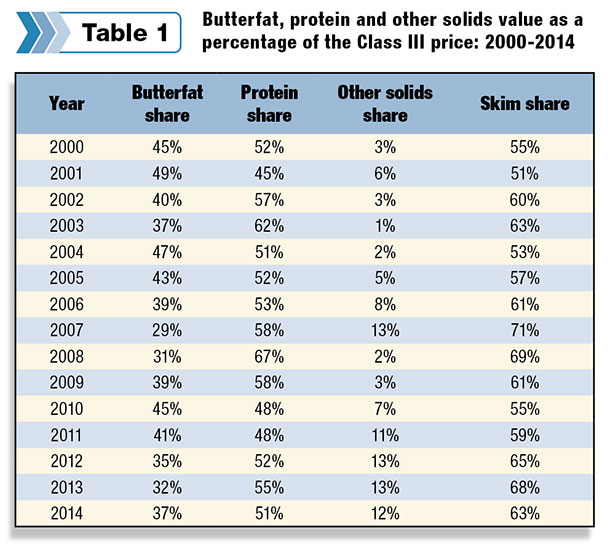
The contribution of each milk component’s value to the total Class III price varies each year, but here are some general observations. Milk’s skim value (protein + other solids) consistently represents more than half of the Class III price. In recent years, it was about 60 percent of the total Class III price.
The contribution of protein to the milk price ranged from a low of 45 percent back in 2001 to a high of 67 percent in 2008. Butterfat represented almost 50 percent of the milk price in 2001 but dropped to 29 percent in 2007. As discussed earlier, the contribution of other solids to the milk price has increased significantly over time, providing 12 percent of the Class III price in 2014.
I predict over the next few years, on the average, about 40 percent of the Class III price will come from butterfat. Protein will contribute about 50 percent and other solids about 10 percent of the Class III price.
Dairy farmers’ responses
One of the objectives of MCP is to give dairy farmers the economic incentive to increase the component content of their milk production, especially protein. It is the solids in milk (butterfat, protein, other solids) that determine the yield of most manufactured products.
In manufacturing cheese, which utilizes more than half of the nation’s milk production, protein is the most important factor in determining yield. In other words, the more protein in milk, the more cheese manufactured from that milk. Dairy farmers have responded positively to MCP, especially in increasing protein content (see Table 2).
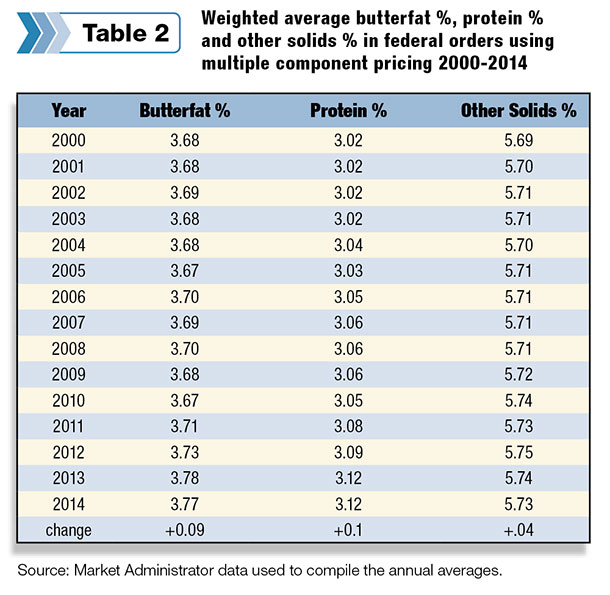
In 2000, the average protein content of dairy farmers’ milk production, in orders using MCP, was 3.02 percent. During the past two years, protein was 3.12 percent, a full point higher than in 2000. Note also that butterfat increased as well, and there was a small increase in other solids.
What have dairy farmers done to increase the components in their milk production, especially protein? It is a combination of several factors. MCP allows dairy farmers to easily and directly see the contribution of the different components to their milk check, which encourages improvement.
Thus, through their breeding and nutrition programs, dairy farmers focus more on improving protein content. Most A.I. companies emphasize the protein transmitting ability of their sires. Plus, the increased use of Jersey genetics has aided the improvement of milk component levels as well.
The economic impact of higher component levels, both at the farm and the plant, is significant. Using 2014 component prices, the 2014 Class III price (average components) is $0.63 per hundredweight higher compared to using 2000 average milk component levels.A 50,000-pound tanker of milk, when manufactured into cheddar cheese, yields 144 more pounds of cheese at 2014 milk component levels compared to 2000.
A cheese plant desiring to manufacture 20 million pounds of cheese per month can receive 111 fewer tankers of milk, at 2014 milk component levels compared to 2000, and still produce 20 million pounds of cheese. This is a savings in money, more efficient and improves sustainability.
In summary, milk component values have changed since 2000. The most significant is the increase in the price of other solids. The majority of milk’s value is the skim portion, protein and other solids. This is projected to continue. Most important, dairy farmers have responded positively by increasing component levels, a response that has and continues to provide significant economic benefits both at the farm and plant. PD
Calvin Covington is a retired dairy cooperative CEO and now does some farming, consulting, writing and public speaking.

Calvin Covington
Retired Dairy Cooperative CEO


