


I am happy to now be providing a VAS DC305 tip each month. It will usually be something more advanced in DC305 that is beneficial for monitoring and managing your dairy herd, but not necessarily something everyone may be familiar with.
I am going to start with Guide. Guide was actually introduced in 2007, and many additions have been made to it over the years. Guide permits access to a wide variety (hundreds, in fact) of predefined reports to address a management question.
How does Guide help the user?
With Guide, dairy producers do not need to continually be making items. There are currently more than 400 predefined items beyond the most common items found in a typical cow file. This saves time, and fewer mistakes are made in definitions. It also avoids the need to create commands from scratch. This saves time and the hassle; it eliminates the need to memorize obscure DC305 syntax and FOR statements, and switches are carefully selected to more specifically address management questions.
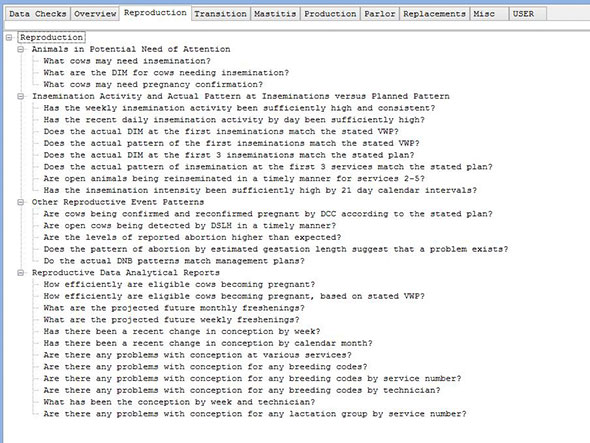
Guide is organized with tabs for key management areas, including reproduction, transition, mastitis, production, parlor, replacements, plus data checks and overviews. There is a user tab that can be used to organize your own most-used Guide reports. Under each tab, there are several management questions, organized via a collapsible menu structure.
Management questions under each tab are organized in an order that lets you start at the top with a herd overview for the management area and then drill down. This is very useful if you have a specific area you want to improve. It helps pinpoint where the bottleneck or problem may be, or when it is occurring. Guide is also very useful for consultants because every report will be the same on all dairies.
To access Guide, you can simply type “guide” at the command line and press enter, or choose it from the side bar menu. Once in Guide, you can maneuver through the tabs of key management areas, choosing management questions. Once you choose a question, it will show you a graph, chart or report to answer the question. If you find ones you would like to routinely monitor, simply right click on the management question and choose to send it to your user tab. This allows you to organize the user tab with your own frequently used management questions.
Next to categories under each key management area, you will see a plus sign; when you click on it, it will expand the menu to show a variety of management questions relating to that category. The minus sign will collapse the menu again. In most reports or graphs, there is an options box in upper right corner. Clicking on the options box opens a dialog box to allow additional modifications of the report or graph. The specific dialog box varies by the type of report or graph.
The combination of Guide and options allows almost unlimited ability to easily create and customize reports or graphs.
– Article submitted by VAS
PHOTO: Photo provided by Valley Agricultural Software.

