


This month’s VAS DC305 tip is a tool you can use to help monitor protocol compliance and analyze disease incidence and reproduction.
Would you like to be able to tell when lactation animals are becoming infected with mastitis? Wouldn’t it be nice to detect if there is an effect from a change in the transition program? Would you like to see your total lame cases categorized by condition? How about being able to monitor the protocols set in place on the dairy and whether they are being followed and administered correctly? EGRAPH can help you answer all of these questions and more.
While EGRAPH has been extensively used in reproduction analysis, it is also very useful for examination of other events such as disease incidence. EGRAPH allows monitoring of the critical processes on a dairy. It allows you to easily view complex data, such as lameness, mastitis, diseases and reproduction (see Illustration 1).
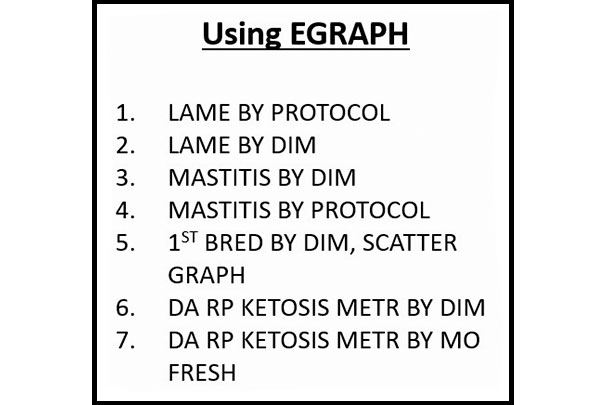
For example, postpartum diseases are the earliest indication of a problem with the transition process. EGRAPH allows rapid visual assessment of disease data. Unfortunately, because of the number of different ways people want to evaluate problems and successes, it has become rather complex. EGRAPH can easily allow users to create and view this complex data.
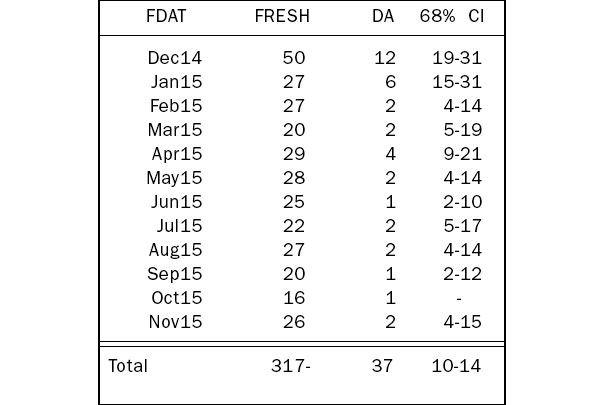
Events can be viewed by calendar month, month of freshening, by days in milk (DIM), age, days carried calf and days since last heat or breeding, all with just a click of a mouse. Care must be taken when looking at events or disease incidences. There is always uncertainty around estimates of incidences. Hence, DC305 expresses risks as 68 percent or 95 percent confidence intervals (CI) rather than simple percentages (see Illustration 2).
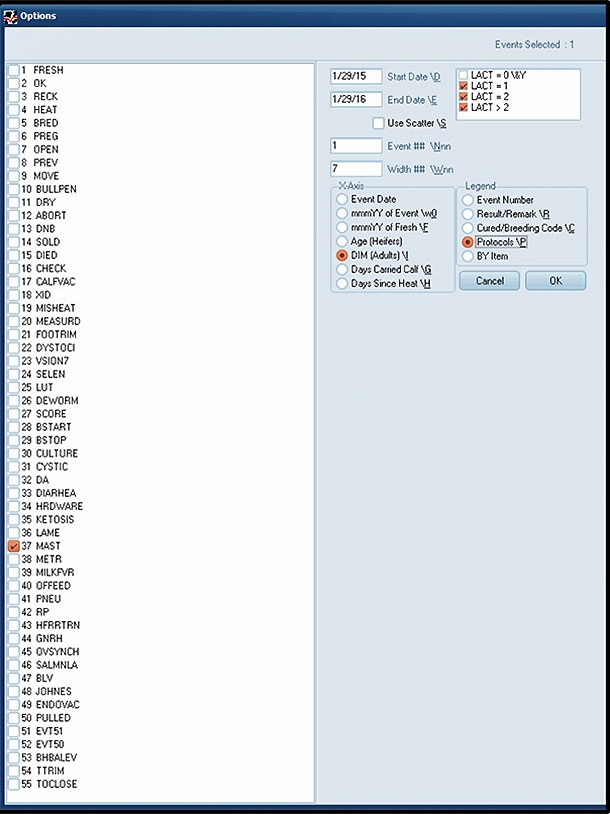
EGRAPH is very easy to use. You simply type “EGRAPH” in your command line in DC305 and press enter. You will then get a box with all of the events you currently have in your DC305 program and options for date range, type of graph, which event number (first, second, blank is all), your x-axis and the legend (what you want to see displayed for the event).
All you do is simply click on your choices and click on OK to display the graph (see Illustration 3). Don’t worry if it is not exactly what you want; you can always click on the options box in upper right corner of DC305 and modify your choices.
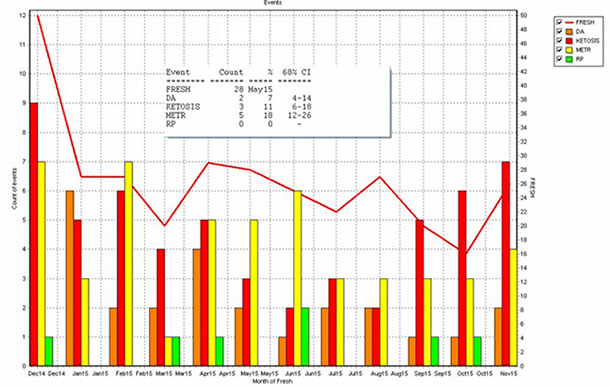
For those of you who like to use the commands, you can also display the same graph with a command. Example: EGRAPH MAST\N1IP. This graph would show you, by DIM, when the first case of mastitis was happening by the treatment recorded on that case of mastitis (see Illustration 4).
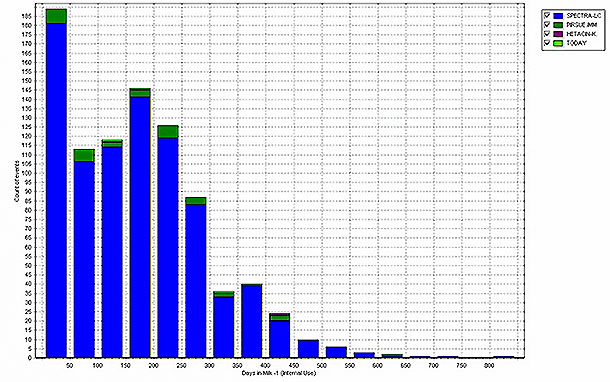
Click on the report tab or hover over any bar on the graph and it will give you actual numbers and the CI (see Illustration 5).
By modifying your options in EGRAPH, you are able to create an unlimited number of graphs to help you monitor protocols and analyze disease incidence and reproduction.
Also, don’t forget last month’s tip, Guide.
– Article submitted by VAS
PHOTOS: Photos provided by Valley Agricultural Software.

