


How much is my milk worth? It depends on who you ask. A milk producer will answer based on the incurred costs of producing the milk, but a buyer of milk, such as a milk plant, will answer based on the value of what the milk goes into. End-product pricing of milk, back tracking from the value of finished products down to a milk value, underlies both the FMMO and California minimum prices. Though modified and tweaked to meet policy goals and practicality, the formulas are straightforward: Product price less a manufacturing cost times the pounds of product from a hundred pounds of milk.

This latter element of the equation – the yield – is the multiplier. Of the four commodities used in government formulas, cheese is an important one. Depending on whether it is worth more than powder, it could represent as much as 80 to 90 percent of the blend prices in the FMMOs. Thus the dairy producer’s question on valuation becomes: How much cheese comes from my milk?
Of the three previously discussed factors in end-product pricing, reporting frequency differs. Product prices are announced weekly, and plant costs are audited annually.
As for yields, they just are what the regulators say they are, with no evidence linking them to actual yields in anything close to the kind of detail and accuracy of product prices and costs.
The plants will not, understandably, disclose proprietary information. The pricing agencies will not or cannot state with the same degree of accuracy as they do with price and costs what the product yields are.
CDFA states that milk with 3.7 percent butterfat of an approximately 8.8 percent solids-not-fat (SNF) has a yield of 10.2, which it incorporates into its cheese milk formulas.
The FMMO expresses yield in terms of butter and protein, never milk, but the formulas for Class III imply a yield of 9.71 pounds from farm test milk of 3.5 percent butterfat (BF) and 2.99 percent true protein.
It is an important number. Differences in yield, even small ones, result in real money. An extra quarter-pound of cheese out of milk, for example, could mean as much as 40 cents more for milk.
Despite this near silence on the part of processors, approximating cheese yield is no secret. In 1890, Lucius L. Van Slyke left the University of Michigan, where he got his PhD several years earlier and took the position as the chief agricultural chemist of what is now Cornell University.
In what was then the center of the dairy and cheese industry, his work contributed greatly to the development of the American cheese industry.
He laid the foundation for the testing of components not only in milk but finished products. Those works from the 1910s are still published. His most enduring work, however, came from a 1894 bulletin entitled, “Investigations relating to the manufacture of cheese.”
By actually measuring the solids that went into the vat and the amount of cheese that came out, he developed a formula that could closely approximate the amount of cheese a given volume of milk with tests would yield.
Not only is this work cited today when cheese yields are the topic, the formula it describes is the basis for the cheese yield formulas in today’s FMMO and CDFA pricing regulations. It is used routinely in the contracts for milk purchases by unregulated plants.
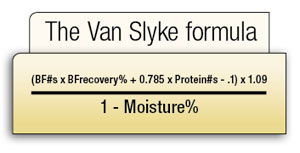
Of all of the factors in the above formula, only one is relatively unknown – the BF recovery percent. The formula’s multiplication factor of .785, or 78.5 percent, is the percent of crude protein that is casein protein, the protein used in cheese.
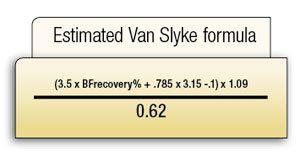
The moisture percent must be less than 39 percent, and is generally 38 percent, to meet standards of identity. Substituting components for a hundredweight (cwt) of standard test milk with 3.5 pounds of butterfat and 3.15 pounds of true protein, the formula would be:
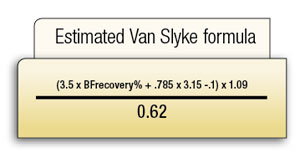
At 90 percent BF recovery, standard test milk will yield 9.71 pounds of cheese from that milk. At the same tests, the CDFA formula would have a yield of 9.83. The differences between the CDFA and the FMMO yields can be explained primarily by the implied butterfat recovery – the FMMO uses 90 percent while CDFA formulas imply 92 percent.
Casein as a percent of protein and moisture are constants. In addition, FMMO further reduces the amount of milk at the farm by 0.15 percent and butterfat by an additional 0.25 percent for “farm shrink,” which in turn reduces the farm milk-to- cheese yield to 9.69. CDFA does not do this.
The only routine public data reporting current cheese yields is published by CDFA in its annual manufacturing cost reports.
Though it does not directly report butterfat recovery, these reports supply enough information to closely approximate the butterfat yield used by the plants which report the sales and costs.
In its 2010 report on 2009 operations, CDFA reported that the vat-to-cheese yield was 13.93 pounds per hundred pounds of vat milk that tested 4.74 percent for BF and 9.66 percent SNF.
On its face, this is insufficient information to use the Van Slyke formula. The ratio of components is not that of cows’ milk, and there is no protein value. The value for SNF alone cannot be used to estimate protein.
These plants are, on the whole, efficient plants. That means these plants are designed and operated to get the most cheese out of milk. The casein acts like a net and holds the butterfat.
Filling the “net” with all the butterfat it can hold is the goal, and to do that, the cheese maker combines milk ingredients to the optimum casein-to-butterfat ratio of approximately 0.70.
By knowing the butterfat, we also know the casein and with those two numbers we can know the butterfat recovery. At 4.74 percent BF, the casein approximates 3.318 percent for optimum yields.
Substituting that for casein in the formula and solving for butterfat recovery, we have the following formula:
The result is a butterfat recovery of 99.36 percent. That is, over the entire year for every cheddar plant in the state, that for every 100 pounds of butterfat coming in the front door, 99.36 pounds of farm butterfat leaves as cheddar cheese.
Or, in dairy producer terms, a hundredweight of milk from the farm with standard tests would yield 10.29 pounds of cheese.
How do you reconcile the differences in butterfat recovery in reality from those used in agency formulas? Despite its singular importance in the formulas, none of the agencies have seen fit to identify and/or report the average butterfat recovery in cheese making. CDFA does actually disclose it, howbeit indirectly, but USDA has not done any research on the subject.
The main reason, however, is that discussion for formulation hearings focuses on single batches of cheese, not the entire plant production as a system.
Butterfat recovery varies from vat to vat even within plants. No batch recovers all of the butterfat. A vat with 94 percent butterfat recovery in a single run will leave 6 percent of the butterfat in the whey stream.
However, cheese plants are not single-batch operators, but a continuous operation of moving milk in one end and finished product out the other.
One of the great advances over the last several decades in cheese making has been the cheese maker’s ability to capture the whey cream and return it to the vat.
That greatly changes the plant butterfat recovery. Mathematically, that is 94 percent plus 94 percent of 6 percent or 5.64 percent for a total of 99-plus percent. Even two runs of 90 percent vat butterfat recovery would result in almost 99 percent plant recovery.
In confirming these numbers with some cheese makers, one reminded me that there is no market for whey butter because there is virtually no supply of whey cream from cheese manufacturing today. As evidence of this, consider the sources that used to report on these production of these products.
The CDFA does not report whey cream or butter as one of its plants’ products, and by 1999 the CME no longer listed Grade B butter as a commodity. The USDA in its Dairy Market News stopped reporting such sales, again due to lack of any product being sold.
From all this one can gather that butterfat recovery is much higher than believed. This tells us how obsolete the current yields are. The lack of product does not confirm a particular butterfat recovery but shows that such recovery in modern plants is almost complete.
Some will argue it is unfair to credit this higher yield for producers because it is not necessarily only from producers’ milk. No one is, or should, argue that producer milk yields 14 pounds. The yield from protein in producers’ milk has long been known.
What has not been well known is how much producer butterfat remained in the cheese, and that is the question that is answered here.
To the extent that plants have fortified the vat (added condensed SNF) to bring the ratio of casein-to-butterfat close to the optimum point, those additional solids do not show up in producer yields, nor should they.
These formulas only address cheddar cheese, and only for those plants who produce the volumes found in the NASS survey. They do not necessarily apply to some niche cheddar varieties.
FDA lists standards for another 94 cheese styles and that does not include the innumerable non-standard cheeses manufactured today.
The bottomline is different styles, different yields. The focus here is on only cheddar because the cheddar cheese price and make-allowances from these plants are the ones used in the formulas.
Yields are vitally important to end-product pricing, and producers should know this. In an era when the government relies upon yields in setting minimum prices, this vital number should be routinely surveyed and reported.
Then we can answer the question of how much cheese comes from a dairy producer’s milk.
The CDFA’s report on costs can be found at CDFA’s Dairy website at Dairy Home – Dairy Publications – Manufacturing Cost ( http://www.cdfa.ca.gov/dairy/uploader/postings/manufacturingcost/ ).
The standards of identity for cheddar cheese are at the Government Printing Office website, Code of Federal Regulation, 21 CFR 133.113 ( http://www.gpo.gov/fdsys/pkg/CFR-2010-title21-vol2/pdf/CFR-2010-title21-vol2-sec133-113.pdf ) PD

-
Ben Yale
- Attorney
- Yale Law Offices
- Email Ben Yale

