What’s in the box?
Forrest Gump’s momma always said, “Life is like a box of chocolates, you never know what you’re gonna get.” In a way, feeding cows is the same. You never really know the true composition of the feeds and diet that make it to the bunk or what makes it into each cow.However, with some discerning choices in purchased feeds and appropriate sampling protocols, you can significantly reduce the uncertainty in diet composition and reduce the risk of under- or overfeeding a certain nutrient.
Many factors affect a plant’s dry matter (DM), crude protein (CP) or neutral detergent fiber (NDF) content, including differences in plant genetics, the soil in which it is grown, fertilizer application rates and methods, and the weather. A feed’s nutrient composition can also be influenced by harvest, processing and storage methods. In addition to all these identifiable causes of variation, there is also some degree of random, or unidentifiable variation.
Finally, when we try to determine the composition of a feed through testing, we also introduce some ‘observer variability’ in how we select the feed sample and the lab methods used to analyze the feed composition. Knowing how much each feed is expected to vary, and how much of that variation is due to identifiable, observational, and random causes, will help establish how often that feed needs to be sampled, how to sample it and how to use the results of the feed sample in ration formulation.
A general idea of the total variation in a feed’s nutrient content can be gained from the standard deviations (SD) in feed composition tables like the NRC (2001) or the CNCPS feed library (e.g. Table 1, select feeds from NRC 2001 feed tables). In these tables, the mean is a measure of the average while the SD is a measure of the variability.
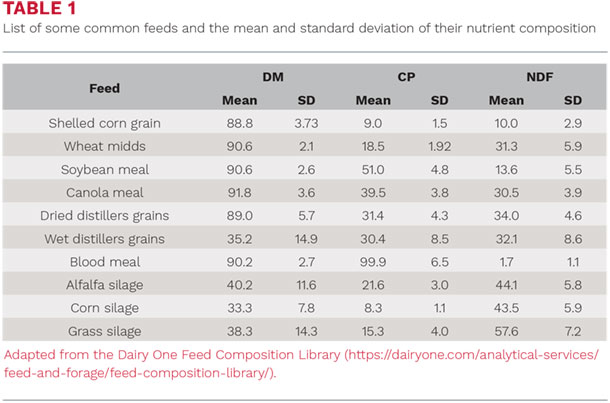
One way to interpret the SD is that, for a normally distributed variable (which we assume for most feeds), 68 percent of samples will fall within one SD of the mean and 95 percent of the samples will fall within two SD of the mean. In the case of dry corn grain, listed in Table 1, 68 percent of corn grain CP samples are expected to fall between 8.1 to 10.7 percent.
In comparison to blood meal whose CP content has a SD of 8.3, the variability in corn grain CP content is quite low. An easy way to reduce variation in composition of the final diet is to limit the inclusion rate of feeds with high variability. However, this is not always practical, so below are some more guidelines to help manage different groups of feeds.
Purchased feeds with low true variation
Feeds like corn grain, soybean meal and cottonseed listed in section one of Table 2 have relatively low identifiable and random variability.
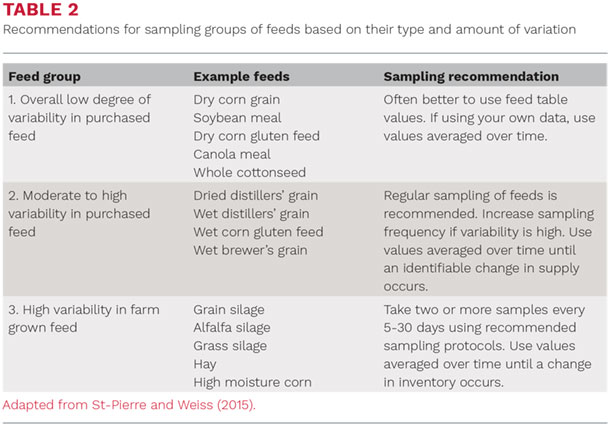
This means that if you sample a recently delivered truckload of corn gluten feed, a large portion of the deviation from the mean is likely due to observational variability. Because of this, it is often better to rely on averaged estimates from national, regional or distributor feed tables rather than taking your own samples. If you do sample feeds in this category, save the results of previous samples and use the updated average of all samples instead of discarding previous information and using a single sample value.
Purchased feeds with moderate to high true variation
Byproducts like potato peels, distillers’ grains and blood meal listed in section two of Table 2 tend to have high levels of variation. For these feeds, true identifiable and random variation is high in comparison to the observational variation, so using your own sampling data significantly improves your knowledge of their nutrient composition. Regular sampling of feeds in this category is recommended. However, the choice to average current results with previous data depends on your ability to identify a factor that would cause the composition to change.
Because you don’t likely know the growing conditions, plant variety or processing methods of byproduct feeds, identifiable causes of variation are limited to the supplier, distributor and delivery batch or truckload. Updating the average composition with a sample from each newly delivered batch is recommended for these types of feeds until you have reason to believe there has been a change in the supply chain, in which case you should toss the old values and begin the process of averaging new values as they come in again. Changing feed mills is one example of when to begin a new average, but communication with your distributor can help you identify if they’ve changed their supplier or have reason to believe there is a significant shift in the composition of a certain product.
Farm-grown feeds
Silages, hays and high-moisture corn have high levels of identifiable, random and observational variation, so managing these feeds can be challenging. Like feeds in the previous section, a well-designed sampling protocol can improve the accuracy of nutrient delivery. Identifiable causes of variation for farm-grown feeds might be the crop hybrid, field or harvest date. Finding ways to separate your inventory by these factors will help you know when you are starting a new batch of feed and should begin a new sample average and reduce the identifiable causes of variation.
How often you should sample each batch depends on many factors, including milk price, the number of cows you’re feeding and the degree of random variation in that feed. Normand St-Pierre while at Ohio State University published results of a renewal reward process model to determine the optimal sampling schedule (St-Pierre and Cobanov, 2007). They found that for small farms with less than 100 cows, the industry standard of sampling every 30 days is sufficient. However, as the number of cows increased, so did the optimal sampling frequency, which leveled off around a suggested sample every five days for farms with more than 300 cows.
Sampling method is also an important factor in the perceived variability of farm grown feeds. Sampling technique is almost as important as sampling at all. When sampling the face of a bunker silo it is important to include silage from the top, middle and bottom, as well as both sides of the silo. However, DO NOT grab a sample by hand directly from the face of the silo as this is extremely dangerous and can cause severe injury and even death.
It is best to wait until the silage has been defaced, and preferably mixed, before taking the sample. Depending on the rate of feedout, if the entire face of the pile isn’t used each day/feeding, ensure that feed from the top, middle and bottom thirds of the silo is included on the day of sampling because DM, in particular, varies greatly from the top to bottom of the pile (Figure 1a).
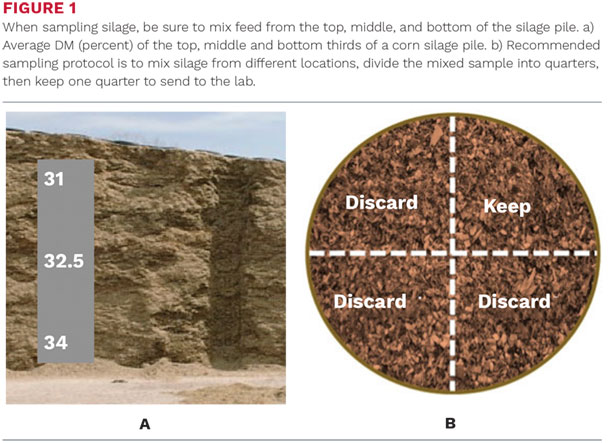
When taking a sample, collect handfuls from the mixed pile or from various locations from the knocked-down pile into a 5-gallon bucket, targeting a 2-pound initial sample. Next, thoroughly mix this sample by hand and dump it onto a clean, flat surface and arrange it into a circle. Divide the circle into quarters and put one of the quarters into a ziplock back to store in a cool place until it can be sent to the lab (Figure 1b). For bagged silage, be sure to collect samples across the face of the bag, and at different points along the length of the bag, starting a new average with each bag or field. Finally, due to the high amount of sampling variation, it is generally recommended to take two samples each day.
Don’t listen to Forrest
Like the map that comes in some boxes of chocolates, you can use feed composition tables to divide your feeds into management categories like those in Table 2. Then, developing a carefully laid-out sampling protocol based on recommendations presented here and elsewhere, you will have a much better idea of what your cows are getting, and reduce the risks of under and overfeeding. ![]()
Kristan Reed, is an assistant professor, Northeast Agribusiness and Feed Alliance Partners Sesquicentennial Fellow in Dairy Cattle Biology, Department of Animal Science. Email Kristan Reed.
Get to know Kristan Reed
Kristan Reed joined Cornell in fall 2018 as assistant professor, Northeast Agribusiness and Feed Alliance Partners Sesquicentennial Fellow in Dairy Cattle Biology, Department of Animal Science.
She is creating an open-source model that looks at the farm, from crops to cows, as a whole system. The model simulates flows of carbon, nitrogen and phosphorus to identify how to improve farm production efficiency and minimize environmental impacts. She plans to partivipate in many of PRO-DAIRY's extension events and will develop online courses in dairy nutrition and farm nutrient management at Cornell.
Reed grew up in the U.S. Virign Islands and received her B.S. in animal science from Cornell University in 2007 and her Ph.D. in animal biology from the University of California, Davis in 2016. She has also been a postdoctoral scholar with USDA-ARS U.S. Dairy Forage Research Center, Madison, W.I. and served in the Peace Corps in Lesotho.
Photo provided by Allison Usavage
This article appeared in PRO-DAIRY’s The Manager in July 2019. To learn more about Cornell CALS PRO-DAIRY program, visit PRO-DAIRY Cornell CALS.