


In these figures and text, Progressive Dairy seeks to summarize the ups and downs of pooling and depooling, milk class prices and producer price differentials (PPDs) in 2021, all of which have heightened calls for potential FMMO reform. This summary does not specifically address Class I fluid milk, which is a ride of its own.
Pooling tide has turned
Fluctuating Class III-IV milk prices provide incentives for milk handlers to pool or depool milk each month. There are some limitations: Each FMMO has its own rules regarding milk pooling, depooling and repooling.
In general, the wider the spread between Class III-IV prices, the greater the incentive to depool the higher-priced class of milk, keeping the value for the handlers’ own milk suppliers instead of sharing it across the entire pool. That’s why – at the height of pandemic-induced market disruptions and unintended consequences of federal dairy policies in 2020 – we saw milk prices paid to dairy producers within the same FMMO vary by as much as $10 per hundredweight (cwt), as some handlers depooled large volumes of Class III milk.
The past year has provided some lingering effects and contrasting pooling and depooling numbers. To start the year, the value of protein supported Class III milk prices, while weaker butterfat values pressured Class IV milk prices lower. In a continuation of pooling trends in the second half of 2020, less Class III milk was pooled (Figure 1) through the first five months of 2021.
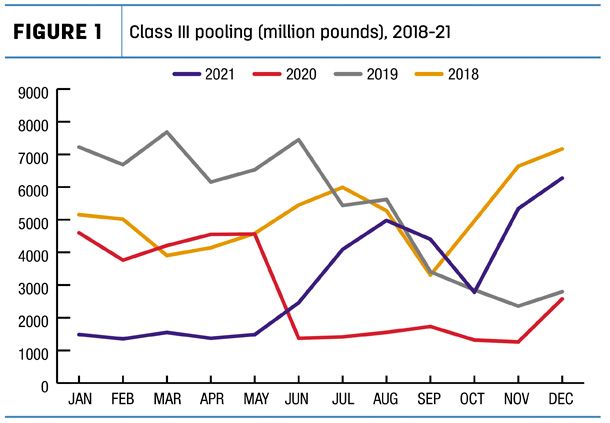
In fact, the volume of Class III milk pooled during January-May 2021 was the smallest for any five-month stretch dating back more than a decade. (Current FMMO records are available starting in 2010.)
That changed mid-year, when the spread between Class III-IV milk prices narrowed and Class III depooling incentives were reduced. By December 2021, the volume of Class III milk pooled across all FMMOs was the highest since early 2019, shortly after California joined the FMMO system.
Class IV pooling followed an opposite track. With butterfat values gaining steam, less Class IV milk found its way to the FMMO pool starting in August (Figure 2).
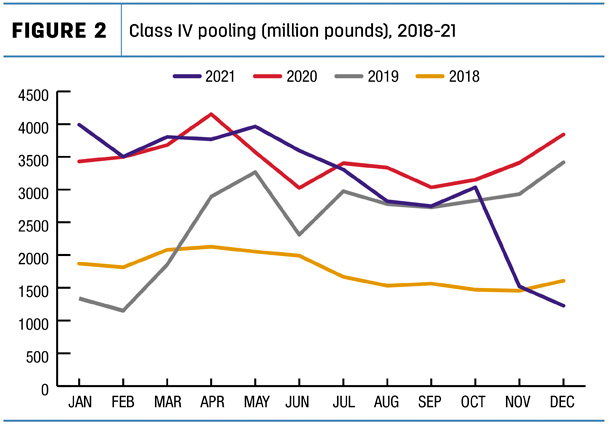
By December 2021, the volume of Class IV milk pooled fell to about 1.23 billion pounds, the smallest volume since November 2015 – three years before California joined the FMMO system and in a year that saw total U.S. milk production almost 16 billion pounds less than in 2021.
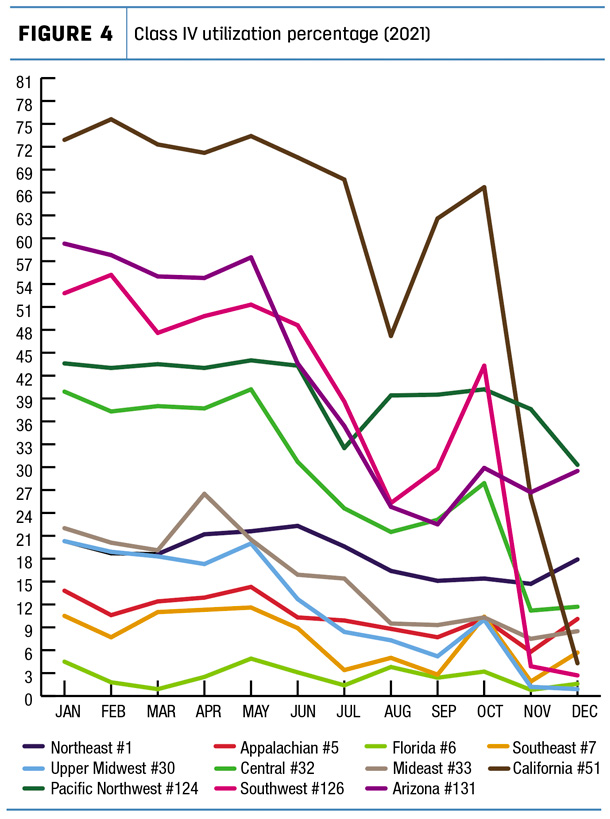
Similar trends were evident in milk class utilization percentages, resembling even more of a roller coaster (Figures 3 and 4).
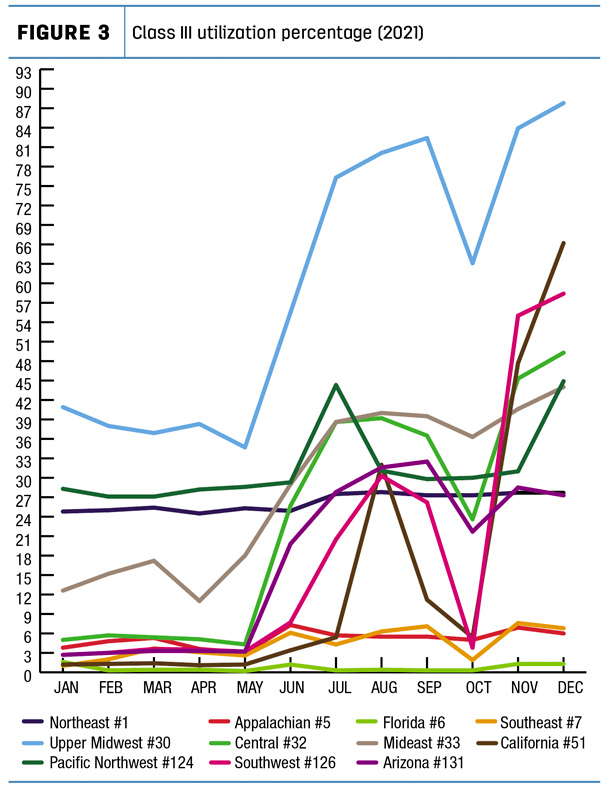
Class III utilization across all FMMOs held at about 14% during January-May, but as the Class III-IV milk price relationship reversed, it hit about 50% of total milk pooled in December.
In contrast, Class IV utilization averaged about 35% for the first half of the year. By December, it had fallen to less than 10%, the smallest percentage since early 2019.
Uniform prices rise
Differing milk class prices and utilization rates factor into “blend” or uniform milk prices paid to producers within each FMMO. The good news for producers in 2021 was that, except for a dip in late summer and early fall, uniform prices paid at standardized test rose throughout the year (Figure 5).
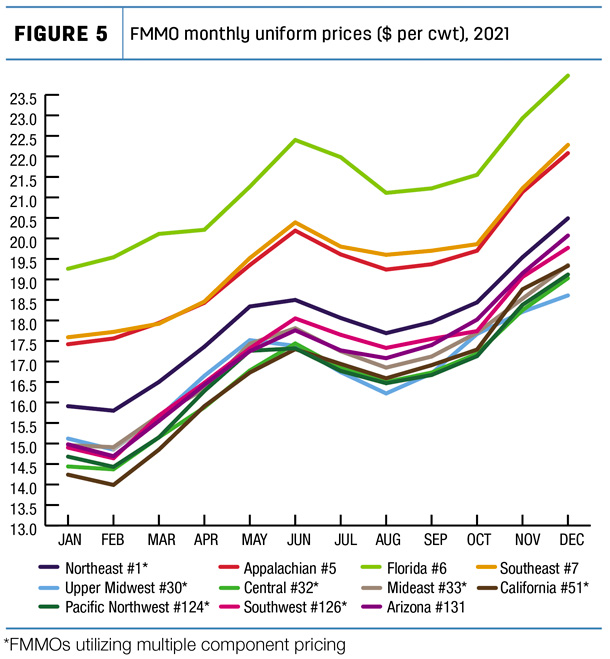
By December 2021, the advanced Class I base price moved to a 12-month high, the Class II milk price was the highest since November 2014, the Class III price was the highest since May, and the Class IV milk price hit a seven-year high. All of that led to the highest uniform prices since November 2014.
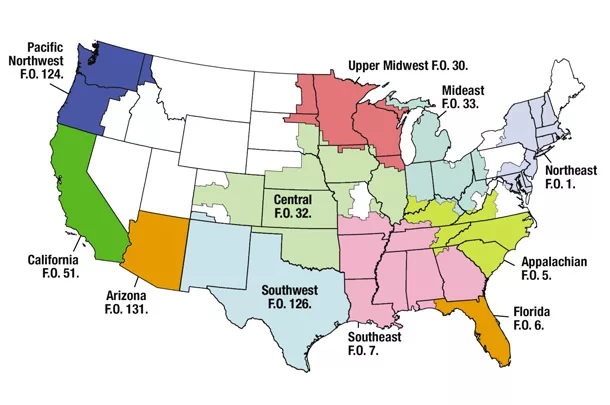
What prices producers actually receive in their milk checks differs, depending on the FMMO. Without getting too far into the weeds, seven FMMOs – Northeast, Upper Midwest, Central, Mideast, California, Pacific Northwest and Southwest – use multiple component pricing, factoring in values for protein, butterfat and other solids. Four other FMMOs – Appalachian, Florida, Southeast and Arizona – use pricing formulas based on butterfat and skim pricing and do not incorporate proteins.
Producer price differentials (PPDs)
Finally, factoring into the uniform prices in the FMMOs using multiple component pricing are PPDs, a topic probably drawing more angst over the past 18 months than any other.
In simplest terms, think of an FMMO as actually having two pools: one of milk and one of money. Milk producers put in milk and draw out money; milk users put in money and pull out milk. With time lags, etc., the values of what goes in doesn’t always match the calculated value of what goes out. Unlike the federal budget, however, the pools have to be in balance, so PPDs are an accounting method to do that. FMMOs announce baseline PPDs each month, a sum that either adds to or takes away from the uniform milk price to keep things balanced.
Another aspect of PPDs, based on past analysis of producer milk checks within the same FMMOs, is that individual milk handlers may apply PPDs to milk checks differently, and additions or deductions may not always be fully transparent. PPDs also have zone differentials within individual FMMOs.
For FMMOs using multiple component pricing, the past year (like most years) has brought both negative and positive PPDs (Figure 6), although the swings were not nearly as severe as in 2020’s pandemic-induced and dairy policy-impacted gyrations.
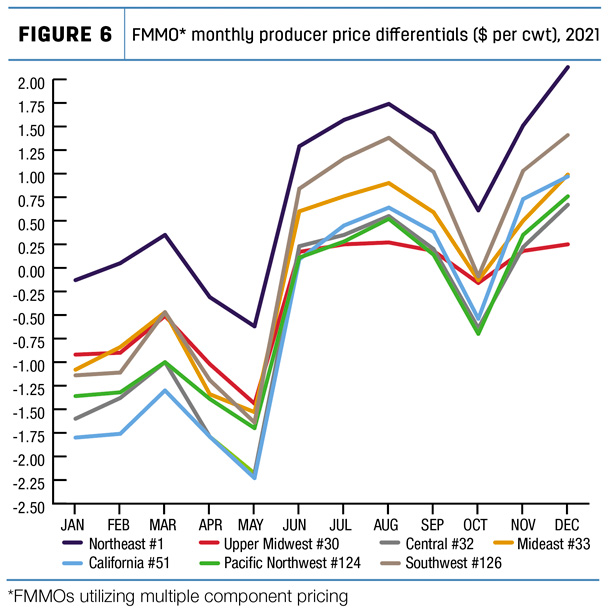
Looking back at 2020, the range of annual average baseline PPDs was -$0.99 in the Northeast to -$3.41 in the California FMMO, with a weighted average of -$1.80 per cwt across all seven FMMOs.
Although 2021 average PPDs weren’t released at Progressive Dairy’s deadline, the ranges will be far less dramatic.
Looking ahead
Based on Chicago Mercantile Exchange (CME) milk futures prices as of mid-January, milk class prices will be higher in 2022, and the Class III-IV milk price relationship could continue into 2023. Milk markets change, especially if the higher prices drive milk production higher, so we can expect the FMMO ride to continue. ![]()
-
Dave Natzke
- Editor
- Progressive Dairy
- Email Dave Natzke


