


December 2020-21 recap at a glance
Reviewing the USDA preliminary estimates for December 2021 compared to December 2020:
- U.S. milk production: 18.825 billion pounds, down 0.1%
- U.S. cow numbers: 9.375 million, down 67,000 head
- U.S. average milk per cow: 2,008 pounds, up 11 pounds
- 24-state milk production: 18.006 billion pounds, unchanged
- 24-state cow numbers: 8.88 million, down 42,000 head
- 24-state average milk per cow: 2,027 pounds, up 8 pounds
Source: USDA Milk Production report, Jan. 24, 2022
Quarterly estimate
With December’s preliminary estimate, U.S. milk production during the October-December 2021 quarter totaled 55.5 billion pounds, down 0.1% from the same quarter of the prior year. The average number of milk cows in the U.S. during the quarter was 9.38 million head, 67,000 head less than the July-September quarter, and 46,000 head less than the same period last year.
November numbers revised lower
The USDA revised November’s estimated milk production and number of cows down slightly. Revisions to estimates in the 24 major dairy states cut about 16 million pounds of milk (about 0.1%), with cow numbers down 3,000 head.
December cow numbers drop
U.S. cow numbers declined for a seventh consecutive month and are now the lowest since August 2020. December 2021 cow numbers were also down 7,000 from the revised November estimate and are now also down 132,000 head since peaking in May 2021.
In the 24 major dairy states, December 2021 cow numbers were down 42,000 from a year earlier and down 8,000 head from the revised November estimate. The 24-state dairy herd is now down 115,000 head from the May 2021 peak.
Compared to a year earlier (Table 1), December 2021 cow numbers were reported higher in eight states and lower in 14 states; Oregon and Vermont were unchanged.
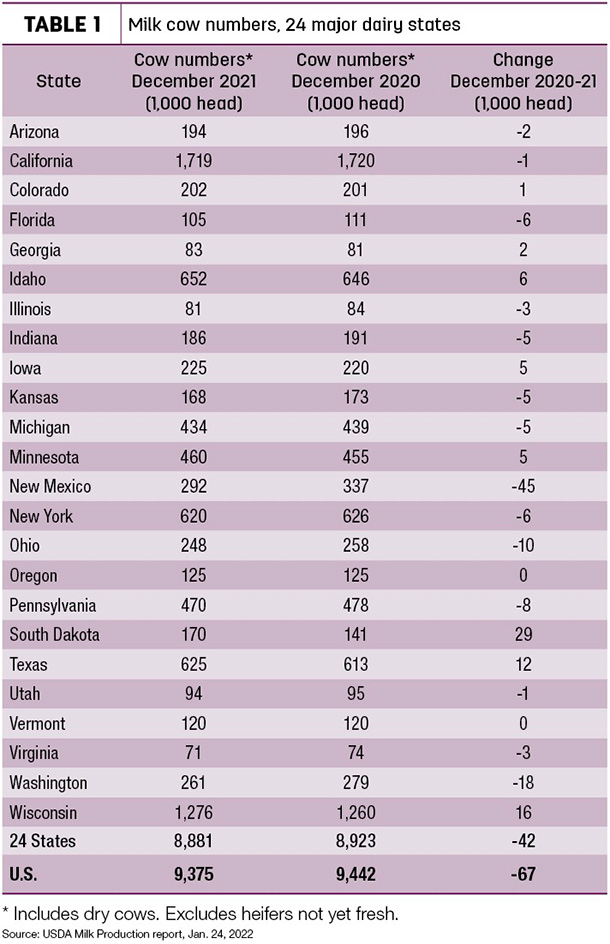
For a second consecutive month, it was South Dakota atop the growth tables, up 29,000 head from December 2020 and up 4,000 head from November 2021. Wisconsin cow numbers were up 16,000 from a year earlier, with Texas up 12,000 head.
Compared to a year earlier, cow number declines continued in New Mexico (-45,000), Washington (-18,000) and Pennsylvania (-8,000). Compared to a month earlier, New York cow numbers were down 5,000 head, with New Mexico cow numbers down 3,000.
Dairy cull cow marketing picks up
Cull cow slaughter played a role in the shrinking milk herd size to end the year, with cows sold for beef in December up substantially from November.
At 267,800 head, December 2021 dairy cow slaughter in federally inspected plants was up more than 22,000 from November 2021. For all of 2021, dairy cull cow slaughter was estimated at 3.1 million, about 42,700 head more than 2020.
Growth in milk per cow slow
Overall monthly U.S. production per cow rose just 11 pounds compared to December 2020. California and Virginia posted the strongest gains, up about 1.5 pounds per cow per day, with Texas up 1 pound. On the other end of the spectrum, dairy output per cow was down in 12 states, led by New Mexico, Vermont, Illinois and Arizona (Table 2). Michigan maintained its lead over Colorado in milk output per cow.

Milk volume lower
Among major dairy states, year-over-year production was down in 14 states, led by declines of 106 million pounds in New Mexico, 41 million pounds in Washington and 22 million pounds in both New York and Pennsylvania.
California led all states in terms of December year-over-year milk volume growth, up 75 million pounds, followed by South Dakota, up 55 million pounds, Wisconsin, up 46 million pounds, and Texas, up 44 million pounds.
On a percentage basis, December 2021 output in South Dakota was up 20% from a year earlier. More subdued growth occurred in Texas (3.4%), Georgia (2.6%) and California (2.2%). New Mexico and Washington led decliners, down 15% and 7.3%, respectively. ![]()
-
Dave Natzke
- Editor
- Progressive Dairy
- Email Dave Natzke

