
When it comes to your dairy, knowing what drives profitability allows you to take control of your operation. Visibility on return, whether it be return over feed or return over quota, allows you to steer your business in the right direction.

Below, I address some of the top questions concerning profitability by pulling data from our return over feed (ROF) databank covering 14,000 ROFs from 3,600 dairy farms across eastern Canada to help you make strategic decisions.
Increasing production, does the additional cost outweigh the benefit?
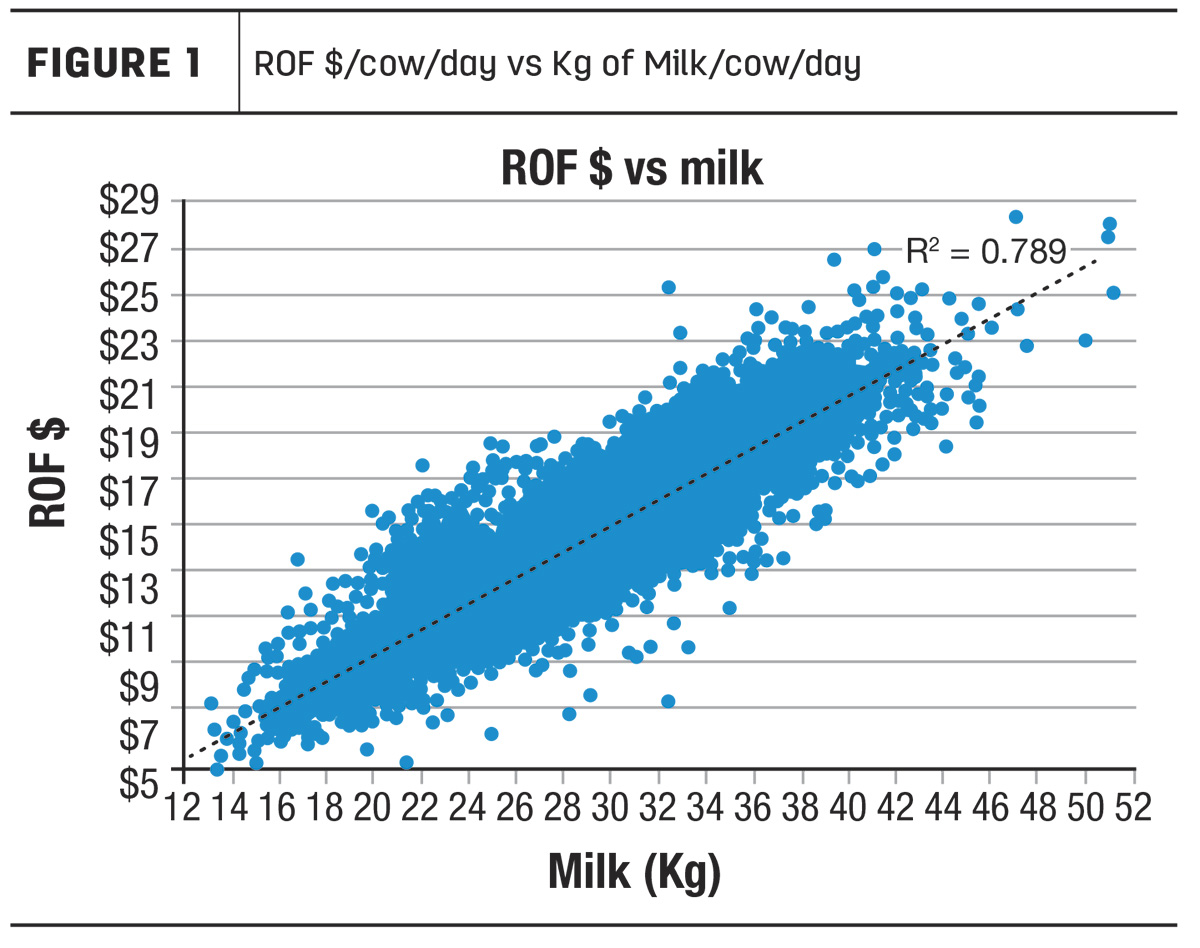
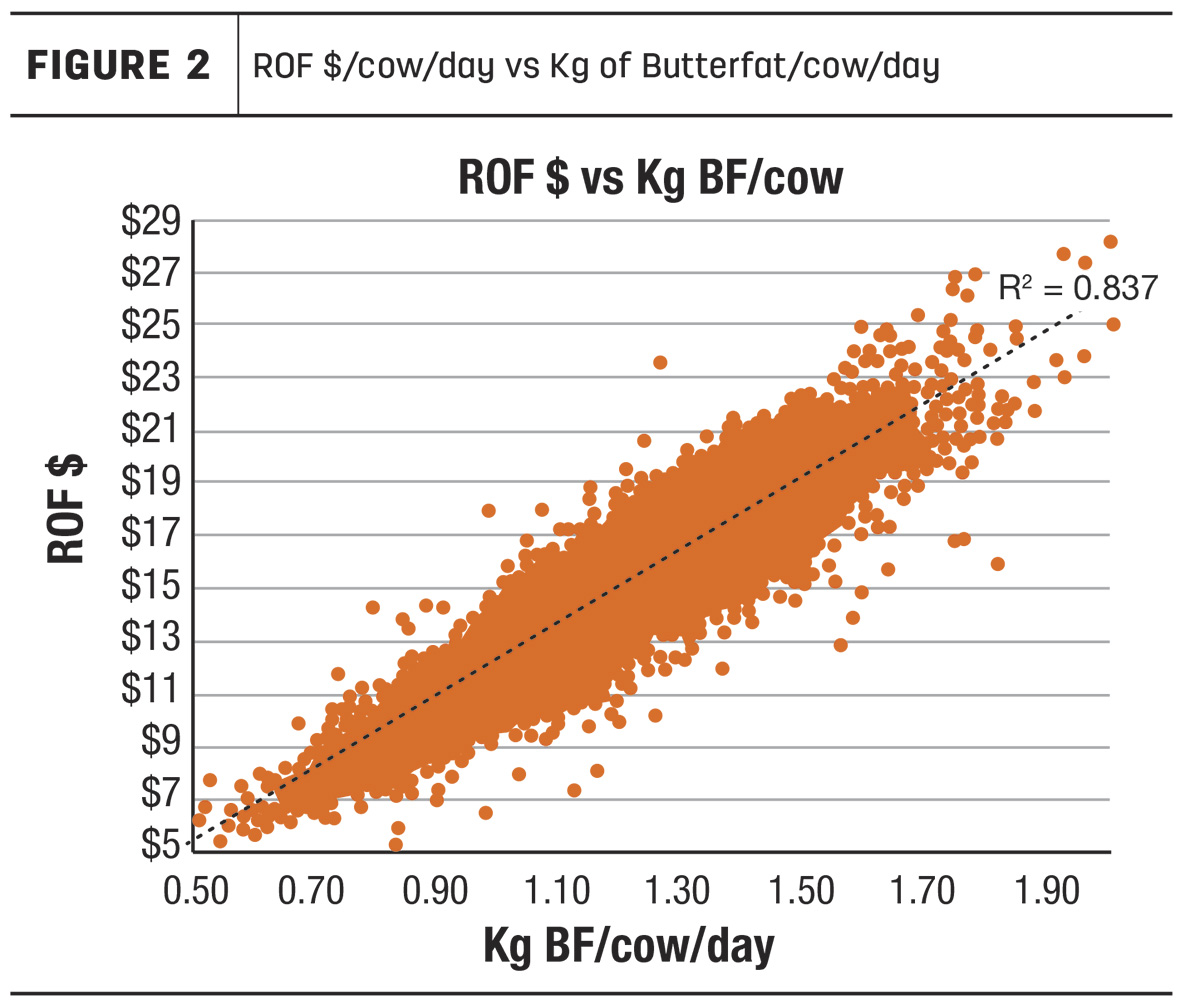
Year over year, strong milk production has resulted in greater ROF. In the past year, the top 10% of producers continue to find ways to increase production levels with kilograms of butterfat per cow per day reaching an impressive 1.73 kilograms, with the top producers exceeding 2 kilograms per cow per day in the bulk tank. Despite greater feed costs on a purchased and total feed cost basis, herds that are in the over-45-litre category have an advantage of $8.42 ROF per cow per day over the average herd in the 30- to 35-litre category. On a 100-cow dairy, that translates into the potential to fill an additional 54 kilograms of daily quota, resulting in an additional revenue opportunity of over $425,000 on an annual basis.
Quite notably, 79% of the time more milk and 84% of the time more kilograms of butterfat generates a greater ROF. This trend is similar across a variety of increasing production ranges and when looking specifically at the top producers. See Figure 1 and Figure 2.
Although the top 25% of herds spend more money on total feed and grain, their DMI intake advantage of over 1.5 kilograms per cow per day results in higher production. Along with that, cows from these herds convert feed into milk and components more efficiently, a direct result of better forage digestibility, longevity and shorter days in milk (DIM) also seen on these dairies.
How does milking frequency impact my ROF?
king system, there is a benefit to both 3X and robotic herds over 2X herds with an advantage of 14% and 13%, respectively, in milk production. That advantage results in an increase of $2.07 per cow per day for robotic milking and $3.43 per cow per day for 3X systems.
Dry matter intake (DMI) and feed costs with both 3X and robotic herds are higher than 2X herds; however, the increase in milk revenue results in a better ROF average for both. In terms of purchased feed costs, robotic herds are tracking higher than their 2X and 3X counterparts because the concentrate through the robot is typically replacing some homegrown grain in the ration. Nearly 80% of the top 25% of herds on ROF are milking more than 2X, whereas only 32% of the bottom 75% of herds are milking more than 2X.
Should I reduce costs and milk more cows or continue to aim for higher levels of production in a quota system?
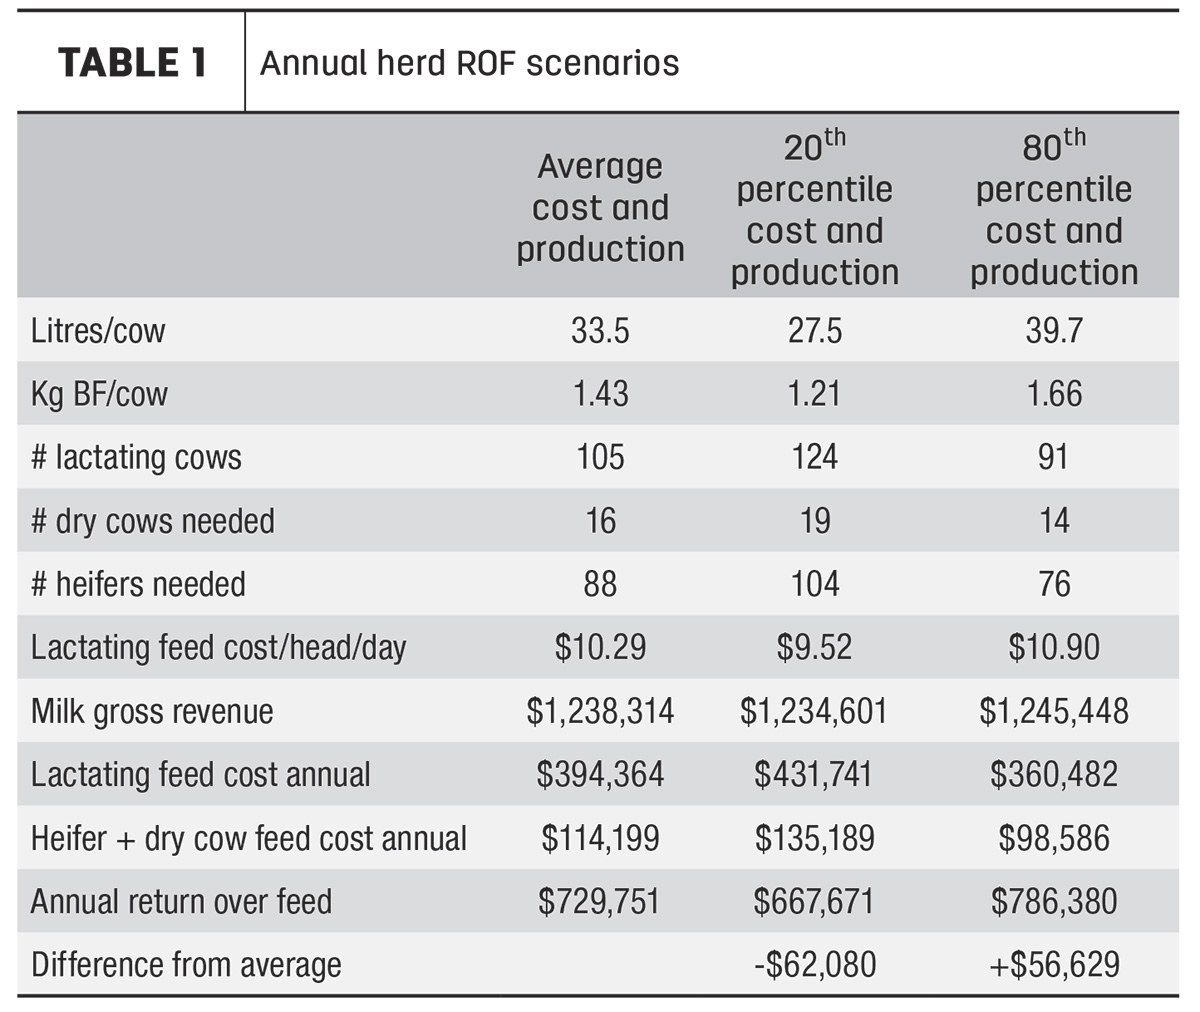
Let’s imagine a scenario of three farms all aiming to fill 150 kilograms of daily quota. To keep things simple, assume that all three farms have the same ratio of milking to dry cows, have the same culling rate (35%) and age at first calving (24 months), resulting in the same ratio of heifers to mature animals. Additionally, in this scenario the feed costs per head per day of the dry cows and heifers are the same across all three farms.
In this scenario, feed costs and production numbers for the average farm, the 20th percentile and the 80th percentile are taken from the ROF database in the last calendar year, with milk pricing being reflective of current eastern Canadian markets at the time of writing.
When comparing the average herd to the herds in the 20th percentile and the 80th percentile, 19 more lactating cows and 14 fewer lactating cows are needed, respectively, to fill their daily quota based on their average production levels. Along with that, the 20th percentile herds would feed 19 more non-lactating animals in addition to their higher lactating cow inventories, and the 80th percentile herds would feed 14 fewer non‑lactating animals along with their lower lactating cow inventories when compared to the average herds.
Milk revenues based on filling the 150 kilograms of daily quota vary slightly with a slight advantage to the 80th percentile herds as their solids‑not-fat (SNF) ratios are slightly higher, meaning they shipped more protein and other solids along with their butterfat.
Even though the 20th percentile herds have lower lactating feed costs on a per-cow per-day basis, the fact that they would feed more total animals results in an annual herd level feed cost that is over $58,000 higher than the average herd, while the 80th percentile herds would feed fewer total animals and have an annual herd level feed cost that is over $49,000 lower than the average herd.
When calculating an annual herd-level ROF, the 80th percentile herds have an advantage of over $56,000 per year compared to the average, while the 20th percentile herds have an annual herd-level ROF $62,000 lower than the average herd in a scenario of 150 kilograms of daily quota. In a quota system, aiming for higher production, even with increased feed costs on a per- cow basis, results in greater annual profitability.
I struggle to achieve a high pregnancy rate, what does this mean for my ROF?
When it comes to reproduction, the top 25% of ROF herds have a 3% higher pregnancy rate on average, resulting in shorter DIM by 11 days and leading to a larger number of cows close to peak lactation within the herd. In this group of herds, when we look at a combination of better reproduction and greater milkings per day, there is a difference in production of 6.7 litres per cow and 0.28 kilogram of butterfat per cow per day.
The top 25% of herds on an ROF basis also have an advantage when it comes to herd health and heifer raising. They have an age at first calving of 1 month younger, but interestingly the percentage of animals in first lactation is almost identical at close to 35%. Better grown-out heifers that produce well compared to their mature counterparts is one key to success in the top herds. The top 25% also have a somatic cell count (SCC) that is lower by 33,000, pointing to better udder and overall health, resulting in less dietary energy being partitioned to the immune system and instead being used for production and reproduction.
Have you calculated your herd’s ROF? Analyzing this number allows you to take action to drive profitability and benchmark improvements. With greater market volatility and higher costs of late, few things in the dairy industry have remained consistent; however, investing to increase milk per cow and kilograms of butterfat per cow have always yielded the greatest return.


