Do the continually changing industry selection indexes and recent genetic base change have you questioning what that means for your genetic plan? The recent genetic base change caused an industry-wide rollback for most traits for all bulls, cows and heifers. Previously, we determined proof values for a sire by comparing his daughters to the average cow born in 2005.

However, since cows born in 2005 are now 10 years old, and many are no longer in the herd, we now compare daughters of a bull to the average cow born in 2010 for a more accurate and relevant proof value on all traits.
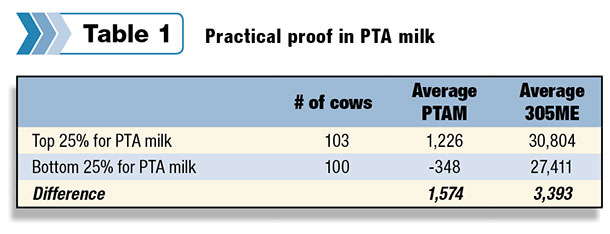
For example, Table 1 shows that this farm’s top quartile of cows for PTA Milk (PTAM) averages 1,226 pounds of milk. This value means this group of cows is predicted to produce 1,226 pounds more milk than the average Holstein cow born in 2010.
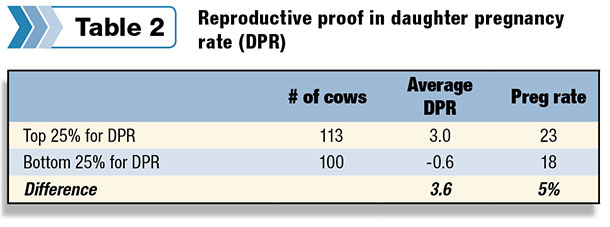
In the same way, Table 2 shows that the top 25 percent of cows for daughter pregnancy rate (DPR) are predicted to have a 3 percent higher pregnancy rate than the average cow born in 2010.
The proof is still there
Regardless of these industry-wide updates, you can still accurately assess actual performance of various genetic traits within your own herd. With sound management and accurate sire identification, a genetic assessment of your own data will show the real value of your genetic plan.
Do your 2-year-olds produce as much and become pregnant as quickly as their sires’ proofs predict? And do somatic cell scores actually correlate with higher somatic cell counts?
With a genetic assessment, it’s important to minimize environmental effects by taking into account only first-lactation animals. Real genetic impact is proven when management and environment are consistent. So since phenotype = genetics + environment, when environmental influences are completely minimized, actual performance can be attributed to genetics.
You can assess the performance on cows in later lactations as well – but realize the results will be biased. Non-performing cows, regardless of their sire, will likely be culled before reaching later lactations. The most accurate and precise genetic comparisons come from comparing first-lactation animals.
To better grasp how the numbers on your current proof sheet translate to more pounds of milk, more pregnancies, higher milk quality and therefore extra profit, we look to a DairyComp 305 analysis of a real 1,000-cow dairy for answers.
Practical proof in PTA Milk
A herd genetic assessment for PTAM tells you how many more pounds of milk a first-lactation animal will produce compared to herdmates on a 305-day mature equivalent (ME) basis. More milk equals more profit, so to determine if you’re getting the bang for your buck, let’s look at this farm’s test-day information to see if daughters of high-PTAM sires actually produce more milk than daughters of low-PTAM sires.
Within this herd, we’ve sorted all first-lactation animals with a known Holstein sire ID, solely on their sires’ PTAM value, and compared that to their actual 305-day ME milk records.
As Table 1 shows, we expect the best first-lactation cows for PTAM to produce 1,574 pounds more milk on a 305-day ME basis than the bottom 25 percent for PTAM. In reality, we see a 3,393-pound difference between the top PTAM animals and the bottom in actual daughter performance.
Why such a difference between genetics and performance?
While actual performance typically mirrors genetic predictions in many on-farm genetic assessments, here the production exceeds what’s expected by more than 1,800 pounds. As mentioned above, herds with top-level management and accurate sire identification will see that genetics are allowed to be expressed.
When you offer a clean, comfortable and consistent environment for all cows, feed a balanced ration and provide a steady routine, you will realize higher-than-average returns from your genetic inputs.
Perhaps even more important is proper sire identification. Without accurate records, your analysis won’t work because any misidentified cows whose real sire information would put them in the bottom group for a trait could actually appear in the top quartile and vice-versa.
Reproductive proof in daughter pregnancy rate (DPR)
This same 1,000-cow dairy selects for DPR as part of their custom genetic plan. So to see if that selection emphasis is paying off in terms of real pregnancy rates, we’ve sorted all first-lactation cows with a known sire identified, this time exclusively on their sires’ DPR values, to compare the top versus bottom cows for DPR.
One additional point of DPR equals a one-point jump in pregnancy rate (PR), or four fewer days open. So in this herd, the top-DPR cows, with an average sire DPR of 3, are predicted to have a PR 3.6 points higher than the low-DPR group. This equates to a pregnancy created about 14 days sooner.
What this well-managed herd realizes on their first-lactation animals is, once again, better than genetic predictions. Top-DPR cows have a 5 percent higher PR than the low-DPR group. That 5 percent difference equates to 20 fewer days open – almost one full heat cycle.
Profitable proof in somatic cell score (SCS)
Milk quality is an important topic for consideration on every dairy. If you’re concerned about mastitis or somatic cell counts on your farm, or receive milk quality premiums, you likely select for sires with low SCS values as part of your genetic plan.
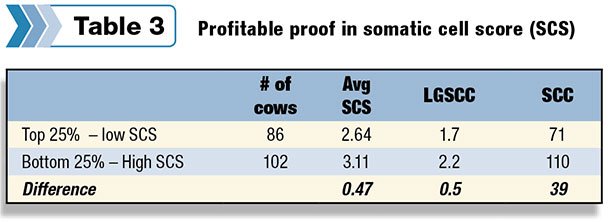
While environment plays the biggest role in your farm’s somatic cell counts, part of it can be attributed to genetics as well. On this same 1,000-cow herd, you can see that the daughters of the favorable low-SCS sires indeed produce milk of higher quality, with a more desirable linear log somatic cell count (LgSCC) and somatic cell count than daughters of the high-SCS sires.
Better genetics translates to better performance
You can analyze additional traits, such as productive life (PL), protein, fat, sire stillbirths and daughter stillbirths at the herd level for even more proof that genetics can make a profitable difference on your farm.
Genetics work, but you cannot see this proof if your animals are not managed well or identified correctly. The traits we’ve analyzed can make a great financial impact as part of your farm’s genetic plan with very little investment. Each of these examples clearly demonstrates that:
1. Regardless of genetic base changes or selection index updates, on a well-managed farm you will see performance results correlating to the genetics you select.
2. If you provide a consistent and comfortable environment, and accurately identify sires, you will likely see animals produce and perform beyond the average expectations of the genetics you use.
3. When you work with your A.I. representative to set a customized genetic plan with emphasis on the traits that make an economic impact on your dairy, you will maximize your herd’s profitability and progress. PD

Chrissy Meyer
Marketing Editor
Alta Genetics