Genetics matter. And they are one of the cheapest investments you can make to improve the profitability and efficiency of your herd. While the numbers on a proof sheet may sometimes seem unrealistic or unclear, once you break it down to see how they translate on a herd-level basis, it becomes very real. Using herd management software programs, we can create a genetic assessment of any given herd to see if their animals truly live up to their genetic potential.

Are 2-year-olds giving as many pounds of milk as their sires’ proofs predict? Do these cows become pregnant as quickly as their sires’ DPR numbers suggest? And do daughter stillbirth numbers prove to be accurate indicators of DOAs?
When we look into these analyses, it’s important to note that we take into account just first-lactation animals in order to minimize environmental effects. Phenotype equals genetics plus environment, so when environmental influences are completely minimized, more of the actual performance is attributed to genetics.
We can compare cows with additional lactations in the same way, but we have to realize the results will be biased. Non-performing cows, regardless of sire, will likely have been culled before reaching later lactations. The most accurate and precise genetic comparisons with the fewest outside factors come from comparing first-lactation animals.
So for a better grasp at how the numbers on the proof sheet translate to more pounds of milk, more pregnancies and fewer stillborn calves, we look to a Dairy Comp 305 analysis of a real 1,500-cow herd for answers.
The proof in PTA Milk (PTAM)
We start with PTAM, which indicates how many more pounds of milk a first-lactation animal will produce compared to herdmates on a 305-day ME basis. Here, we dig into this farm’s data to prove whether including higher PTAM sires in their breeding program truly converts to more pounds of milk in the tank and more dollars in the bank.
In this first example, we compare actual 305-day ME milk records against sire PTAM values to see if daughters in this herd are producing to their genetic potential. To do this, we sort all first-lactation animals with a known Holstein sire ID, solely on their sires’ PTAM values.
As Table 1 shows, based on genetics, we expect the top 25 percent of first-lactation heifers to produce 1,541 more pounds of milk on a 305ME basis than their lower PTAM counterparts. In reality, we see a 2,662-pound difference between the top PTAM animals and the bottom in actual daughter performance.

This means that for every pound of milk this herd selects for, they realize an additional 1.69 pounds of milk. So these first-lactation animals are producing well beyond their genetic potential.
Why do they get more than expected?
In most on-farm genetic assessments, the 305ME values closely match the predicted difference based on sire PTAM. In this example, the production exceeds what’s expected by more than 1,100 pounds. Many attribute this to top-level management where genetics are allowed to express themselves.
This particular herd provides a comfortable and consistent environment for all cows. All of these 2-year-olds are fed the same ration, housed in the same barn and given the same routine. At more than a 40,000-pound 305ME, this is certainly a well-managed herd, which allows the top genetic animals to exceed their genetic production potential.
Perhaps even more importantly, the identification in this herd is more than 95 percent accurate. Without accurate identification, this analysis simply won’t work because some cows whose real sire information would put them in the bottom quartile will actually appear in the top quartile and vice-versa.
The proof in Daughter Pregnancy Rate (DPR)
Another example from the same 1,500-cow herd demonstrates the benefits of selecting for DPR as part of its genetic plan. In the same way as the previous example, we sort the first-lactation animals, this time based exclusively on their sires’ DPR values to compare the top versus bottom quartile of 2-year-old cows.
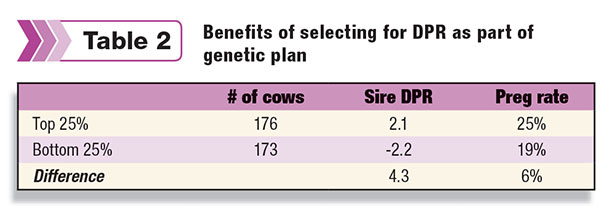
An increase of one point DPR is equivalent to a one-point jump in pregnancy rate, or in other words, four fewer days open. Therefore, in this herd the top DPR cows, with an average sire DPR of 2.1, are predicted to have a pregnancy rate about four points higher than the low DPR group. This equates to a pregnancy created, 17 days sooner, on average.
What this well-managed herd actually realizes on their first-lactation animals is once again, beyond expectations. Top DPR cows have a 6 percent higher pregnancy rate than the low DPR group. That 6 percent difference equates to 24 fewer days open – more than one full heat cycle.
Significant financial benefits certainly arise from the creation of additional pregnancies sooner, putting more money in the farm’s pocket.
The proof in Daughter Stillbirths (DSB)
Calves born dead are an economic loss to a dairy. With this in mind, we set out to determine the reality of DSB figures on a herd-level basis. To clarify, a bull’s DSB value explains the likelihood of his daughters giving birth to a stillborn calf. A higher DSB means a higher probability for future stillbirths.
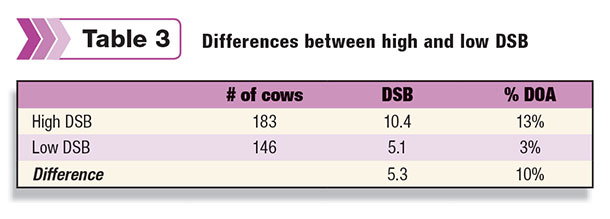
An accurate analysis of DSB depends on the care taken to accurately record DOAs. With accurate records in place for this same farm, the differences between high and low DSB certainly show through.
Here, we sort all first-lactation animals based on their sires’ DSB values. In this herd, the females with the lower, more favorable DSB values had 10 percent more live calves than the first-lactation animals out of high DSB sires.
This huge difference in the number of live calves would certainly make a big economic impact on any dairy.
Genetics are real
In well-managed herds with accurate records, we can analyze additional traits, such as productive life, protein, fat and sire stillbirths at the herd level to gain even more proof that genetics are real.
Genetics do work – at or even beyond expectations. But farms cannot see this proof if their animals are not identified correctly. True analysis of how genetics work in your herd cannot be done without accurate and precise identification and records.
These traits we’ve analyzed can make a great financial impact for your farm, with very little investment. Each of these examples clearly demonstrates the following:
1. Genetics matter, and they are real.
2. On well-managed farms, herd-level genetic assessments prove that you get what you select for.
3. Herds with consistent, comfortable environments, and accurate identification records, often see animals produce and perform well beyond their genetic expectations.
4. If you set a customized genetic plan with emphasis on the traits that make an economic impact on your dairy, you will maximize your herd’s progress, profitability and efficiency. PD

Chrissy Meyer
Marketing Editor
Alta Genetics USA Inc.