


Here’s some news you might not have heard: The USDA has opened up enrollment for the new Margin Protection Program. OK, that really isn’t news. In fact, it seems a cottage industry has sprung up to provide producers with guidance on both the mechanics of signing up for the program and analyzing all kinds of data to help producers in selecting an appropriate margin to insure.

In this article, I do not intend to address either of those issues. Rather, I wanted to look at how the program might affect producers in different situations and geographies.
More so than previous programs, such as the Milk Income Loss Contract program and, looking way back, the Dairy Market Loss Assistance programs, MPP is structured in a more size-neutral manner.
Because the size of dairy operations is often tied to where farms are located, these prior assistance programs also had a disparate impact on the geographic distribution of assistance relative to the volume of milk produced in a particular state or region.
MPP avoids some of that differentiated treatment because it applies to a producer’s entire production volume and is not capped. Although the coverage premiums increase above four million pounds, in other programs, a hard cap acted to exclude all production above a certain amount.
Still, MPP is a national program, and the variables used in calculating the margin are national statistics. Accordingly, the mailbox prices for an area will necessarily differ from the national all-milk price used in the MPP formulas. Likewise, the national prices used to calculate the feed costs in the MPP formulas will differ from the feed costs experienced regionally.
In many of the discussions and presentations to producers on MPP operation, these facts have been emphasized. Producers are being educated to the fact that the calculus about whether to participate in MPP and the level of coverage to elect is based on national statistics and not individual producer income and costs.
But let’s look at some of those regional costs and see what the potential benefit of MPP coverage is for producers in different regions and whether a producer in different regions might elect a different margin coverage.
For this research, I considered five different producers located in California, west Texas, Idaho, Wisconsin and Vermont. I assumed that the producers in California and Idaho had 1,000 cows, the producer in Texas had 2,000 cows, and the producers in Wisconsin and Vermont each had 100 cows. I assumed each producer had an average production per cow of 22,000 pounds.
For each producer, I looked at MPP coverage elections at 90 percent of production and margins of $4, $6 and $8. Using the historical data from 2010-2014 found at www.dairymarkets.org, I found the cost and benefit information for each dairy under each margin level for each year.
After that, I compared the national all-milk price for each period to the applicable state all-milk price for each producer to determine the difference in producer income versus the average.
Finally, I compared the regional feed costs for each producer against the national figures. As an imperfect proxy for an actual local calculation of MPP historical feed costs, I utilized the state hay price indexed against the national hay price used in the historical MPP calculations to approximate the difference in regional feed costs against the national prices used in calculating the MPP margin.
The differences in the regional income and costs allowed me to estimate the disparity across these producers for the same coverage elections. Data for my calculations was sourced from Understanding Dairy Markets and the National Milk Producers Federation MPP website.
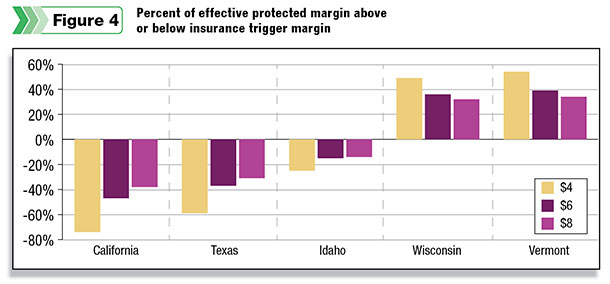
What I arrived at was an “effective protected margin” for each producer in each scenario. The results are summarized in Figures 1 through 4.
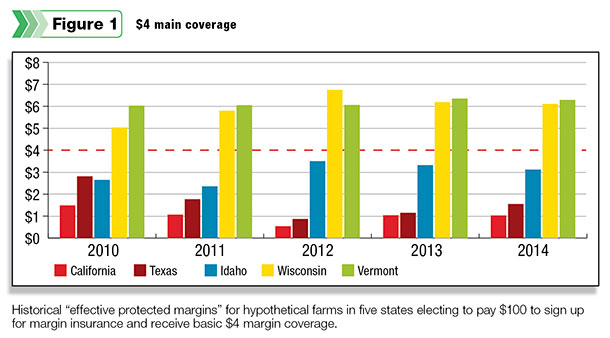
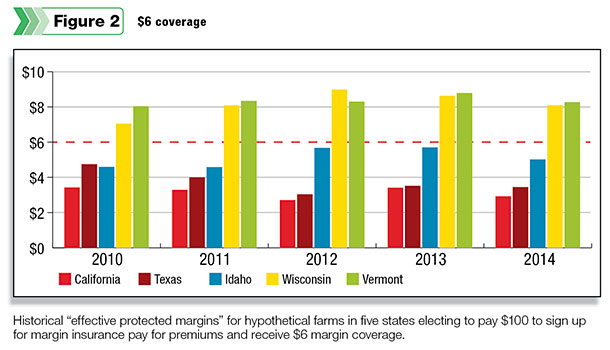
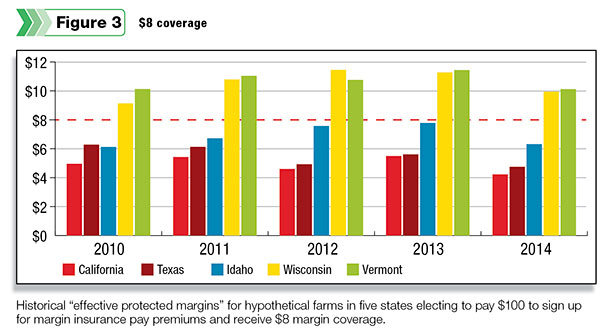
It is important to understand that these figures do not represent payout to producers under any scenario. Rather, what they intend to estimate is the effective margin a producer can protect using the MPP program by analyzing previous years’ data.
By taking into account the differences in regional mailbox prices and feed costs, one can see that producers in the Upper Mideast and Northeast already see a margin over feed costs above the national averages calculated by MPP. Conversely, producers in the West and Southwest have lower margin over feed costs. In some instances, the spread between them is stark – approaching $6 per hundredweight.
It is also important to point out that the payouts under MPP will be identical for producers in each region. Since the payouts are based on national averages, each producer will be paid at the same rate for the same covered margin. The only difference would be the premium paid for the coverage, which will be affected by the size of the producer.
But here is where these regional differences might play a factor in producer sign-ups. For the same $6 margin coverage, a producer in California is effectively covering a $3 margin, while a producer in Wisconsin is covering about $8. Which producer is more likely to pay the premiums to increase their margin coverage from the base $4 amount to $6?
In fact, in virtually every instance, the producers in Wisconsin and Vermont have a higher effective margin protected at the free base coverage level of $4 than either the California or Texas producer can insure at $8. PD

Ryan Miltner
Attorney
The Miltner Law Firm LLC


