It is widely acknowledged dairy cattle must be fed nutritionally balanced rations to deliver absorbable protein with appropriate balances of specific amino acids (AAs) to the small intestine. However, the required levels of these AAs remain unclear.

The most common method of formulating commercial dairy rations uses models that simulate ruminal fermentation, predict rumen escape of nutrients (including AAs) and predict absorption and utilization of those nutrients. However, all current models, such as the Cornell Net Protein and Carbohydrate System, are based upon:
- Numerous assumptions related to AA composition of microbial crude protein (CP) and its digestibility
- Efficiencies of utilization of AAs for milk protein production
- Abide by the simplistic single limiting AA theory
- Are mostly CP-based
- Fail to acknowledge the contribution of endogenous protein to metabolizable protein supply
- Use poorly defined AA requirements of the cows
Little data is available to substantiate any of these assumptions, and attempts to establish ideal concentrations of AAs in metabolizable protein (going back over 30 years) have been unsuccessful. However, this is generally not acknowledged by proponents of predictive models.
In light of difficulties in using metabolic models to predict requirements for AAs, there is a need for a practical and simple on-farm method to estimate real-time AA status of lactating dairy cows. This will allow better evaluation of commercial dairy rations balanced for higher intestinal microbial CP and AA delivery by establishing “normal” ranges using on-farm rations in real time.
A possible practical option is to collect a blood sample from the tail vein of dairy cows, easily performed on commercial dairy farms, and analyze it for concentrations of free AAs in plasma, as this provides representation of intestinally absorbed AAs and is an index of AA availability to the mammary gland.
What we did
A group of 24 commercial dairy farms in California were identified and, from this group, 20 dairy farm co-operators agreed to participate. In order to ensure a representative range of farms and diets, the farms represented all major dairy counties in California, cows were fed a wide range of rations, and the farms had different consulting nutritionists. A group of 20 cows was selected from the target early lactation multi-parity pen on each farm.
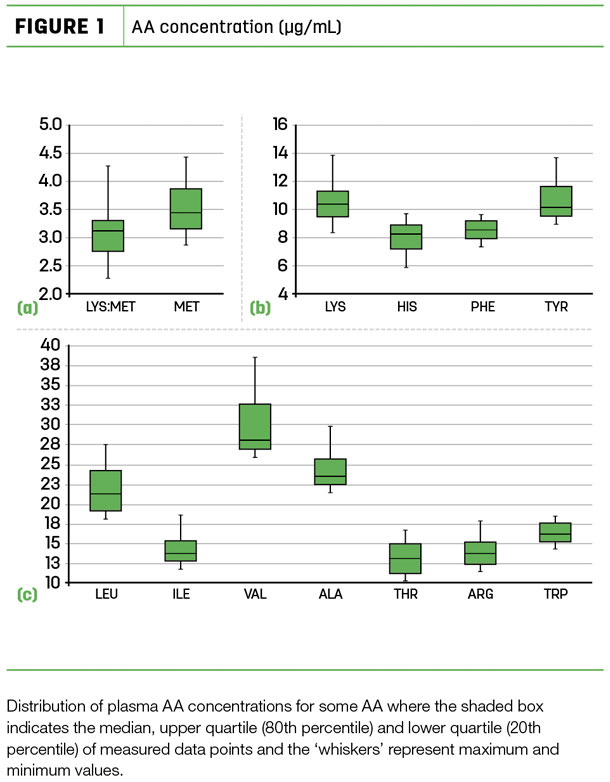
A statistical function was used to construct box-and-whisker plots to define median, minimum, maximum, 20th and 80th percentile calculations for plasma AA concentrations.
What we found
The TMR fed to the 20 target early lactation pens averaged 16.5 percent CP, 19.8 percent starch, 4.7 percent fat and 29.9 percent neutral detergent fiber, with average milk production (99 pounds per day), body condition score (2.63), days in milk (73) and lactation number (2.8), which were all judged to be normal for high-group multi-parity cows.
Statistical analysis determined a composite of six blood samples per group (pen) was adequate to represent the blood plasma AA profile of a specific group of cows. Even with large TMR ingredient differences among the 20 farms, the variation in some of the most important plasma AA among dairies was small (Figure 1).
In addition, there were no correlations between any plasma AA concentration and milk production. Even lysine (Lys), methionine (Met) and the lys-to-met ratio had a very poor relationship with milk production, thereby supporting previous findings of our group that the widely accepted theoretical optimum lys-to-met ratio of 3-to-1 in intestinally absorbed protein does not maximize milk production.
Contrary to expectations, and with corn CP contributions being as high as 47 percent of total diet CP, the ratio of corn CP to total CP in the diets had a small positive correlation with milk production. This concurs with the likelihood ration formulation by commercial dairy consultants included complementary CP sources that offset known imbalances in the AA profile of corn protein.
What it all means
Collecting a blood sample from the tail vein of the cow and analyzing it for the concentrations of AAs in its plasma provides representation of intestinally absorbed AAs and is an index of AAs available to the mammary gland and its surrounding tissue.
Thus, the box-and-whisker plots can be used as an index of “normal” plasma AA values (i.e., averages and ranges) for cows fed commercial dairy rations and as a benchmark of high versus low plasma AA levels in cases where metabolic models are not used to formulate specific intestinal AA deliveries or as confirmation of acceptable diet formulation in general (i.e., if analyzed plasma AA values fall within the 20th to 80th percentile shaded box).
Thus, investigation of possible diet formulation issues may be suggested when actual plasma AA values in a group of cows are outside of their boxed range, especially for potentially limiting AAs.
As methods to analyze plasma AAs are readily available at many commercial laboratories, this approach represents an opportunity to obtain real-time profiles of AA available for milk production, without analyzing the rations fed or estimating AA digestibility or duodenal AA flow data based upon numerous unsubstantiatable assumptions. So if you are concerned about the AA balance of your lactating dairy cows, what are you waiting for? ![]()
N. Swanepoel is a post-doctoral researcher in cooperative extension. Email N. Swanepoel.
P.H. Robinson is a cooperative extension specialist with the Department of Animal Science at the University of California – Davis. Email P.H. Robinson.
An extensive report of this study can be obtained by emailing either author.