


After a couple of months of recovery, producer price differentials (PPDs) took a small step back in April and were again negative in all seven Federal Milk Marketing Orders (FMMO) utilizing multiple component pricing.

Uniform price announcements were released by FMMO administrators, May 10-13, covering April milk marketings. Uniform or “blend” prices posted small increases from the month before, while negative PPDs sunk to January-like levels.
Uniform prices and PPDs
April uniform prices at standardized test were higher in all 11 FMMOs, with a high of $20.21 per hundredweight (cwt) in Florida FMMO #6 and lows of $15.88 per cwt in Central FMMO #32 and $15.91 per cwt in California FMMO #51 (Table 1). The March-April price increases ranged from a low of 10 cents per cwt in the Florida FMMO #6 to a high of $1.13 per cwt in the Pacific Northwest FMMO #124.
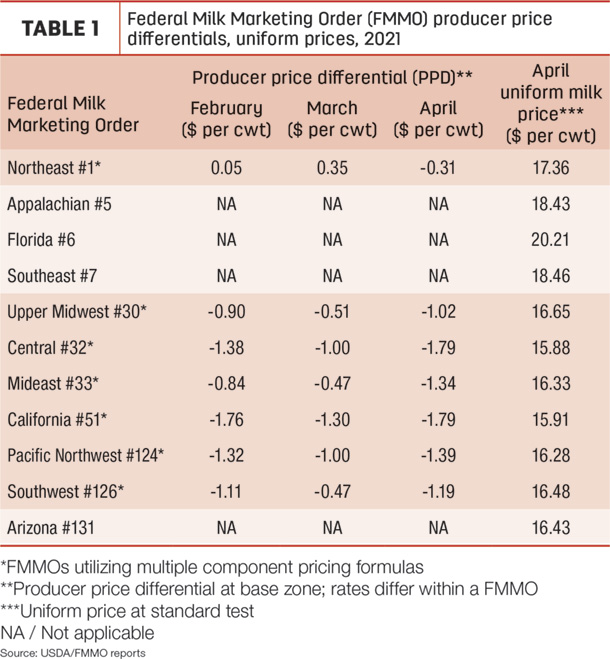
April PPDs went the other direction, dipping 39-87 cents from March. The PPD in the Northeast FMMO #1 moved into negative territory for the first month since January. PPDs have zone differentials, so they’ll vary slightly within each FMMO. In addition, PPDs’ impacts on individual milk checks are based on individual milk handlers.
While some dairy analysts view negative PPDs as simply an accounting tool to balance the value of milk flowing through FMMOs, the PPD depth and duration has prompted calls for USDA intervention. Six FMMOs have now seen negative PPDs every month since June 2020, and the PPD in the California FMMO has been negative for 15 consecutive months, since February 2020.
Marin Bozic, assistant professor and dairy economist with the University of Minnesota, has noted negative PPDs are not a new phenomenon, but factors affecting milk marketing last year drove them to new depths for a longer period. He outlined six primary factors driving PPDs:
1. Long-term milk class utilization rates, highlighted by declining Class I (fluid) milk sales and increased use of milk in manufactured products
2. Rising milk protein tests and differences in how protein value is collected and distributed
3. The spread in Class III-Class IV milk prices
4. The discrepancy between the advanced fluid price issued before the month starts and the full-month average price
5. The new formula used to calculate the Class I mover
6. Depooling
Several of those factors were evident in April. The FMMO April 2021 Class III and Class IV milk prices were $17.67 per cwt and $15.42 per cwt, respectively, a gap of $2.25 per cwt. The April Class III milk price was also above the Class I base price for the month at $15.51 per cwt.
Those class price relationships provided incentives for depooling the higher-valued Class III milk. On both a volume and percentage basis, April levels of Class III milk utilization (Table 2) and pooling were steady or lower than March levels in almost all FMMOs.
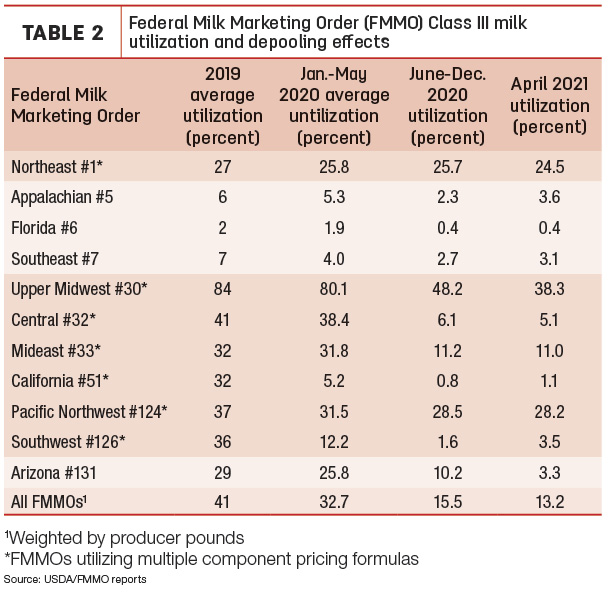
On a volume basis, total Class III milk pooled across all FMMOs in April 2021 was about 1.37 billion pounds, down from 4.55 billion pounds a year earlier, just prior to major milk marketing disruptions caused by COVID-19.
On a percentage basis, Class III utilization was about 13% of all FMMO milk marketings in April 2021, well below the 33% pre-pandemic utilization rate in April 2020 and far below the average of 41% for all of 2019.
Bozic and Cornell University dairy economist Christopher Wolf have teamed up to produce a comprehensive working paper (Negative Producer Price Differentials in Federal Milk Marketing Orders: Explanations, Implications and Policy Options) and a shorter informational letter (Analysis of Producer Price Differentials for March 2021). Both articles are also posted on the Program on Dairy Markets and Policy website.
Looking ahead
The FMMO Class III-Class IV price spread averaged $2.27 per cwt in the first quarter of 2021. As a simple predictor of PPDs and FMMO pooling behavior, Chicago Mercantile Exchange (CME) futures prices indicate that spread will grow wider in the second quarter of 2021 to about $2.56 per cwt, based on Class III-Class IV milk futures prices at the close of trading on May 13. From there, the spread tightens to $2.13 per cwt in the third quarter and closes to $1.13 per cwt in the fourth quarter for an annual average of about $2.02 per cwt, still above historical averages but far less volatile than last year. The 2020 Class III-Class IV price gap averaged $4.68 per cwt in 2020 and averaged more than $8 per cwt between June-November.
The spread, impacting the Class I mover, PPDs and depooling, are the subjects of calls for a potential FMMO hearing and/or USDA intervention.


