


Carbon footprint, carbon neutral, net zero, greenhouse gases, methane emissions; what does it all mean? The phrase “carbon footprint” is a little misleading. The carbon footprint of a person, a farm, or a product, such as milk, is the total of all greenhouse gases (GHGs) emitted on an annual basis.
However, not all GHGs contain carbon. One important GHG that comes from farming activities includes nitrous oxide, or N2O, which does not contain carbon. Along with methane (CH4) and carbon dioxide (CO2), these three gases have important heat trapping traits and are the key GHG emission concerns from agriculture, including dairy farms.
Most scientists agree that human activities contribute to climate change. Human activities are also being affected by climate change, and agriculture is no different. As a result, there is a need for the agricultural industry to not only look at ways to reduce its carbon footprint, but also increase its resilience to the impacts of climate change on both crops and livestock. Depending on the location, changes to local climatic conditions and increased occurrence of extreme weather events, including both drought and flooding, are resulting in increased soil loss, spread of crop and animal disease and pests, and reduced yield and quality of crops and pasture.
Climate change and the need to reduce GHG emissions are topics with great global interest as well, particularly when it concerns agriculture, and dairy in particular. These issues have taken a center stage within the media and policy decisions over recent years. Civil society is also becoming more concerned and making demands on the agricultural industry to “go green.” In response, retailers are taking action within their supply chains to maintain customer satisfaction, or approval of their products.
In October 2020, the Innovation Center for U.S. Dairy announced their Net Zero Initiative (NZI), stating that the U.S. dairy industry will become carbon neutral by 2050. In addition, there are an increasing number of global, regional, and state climate change targets for dairy and the agricultural industry in general, while processors and retailers are also taking actions to cut the carbon footprint of their supply chains to satisfy customer concerns. As a result, some dairy farmers are being required to calculate, report, and reduce the carbon footprint of their farm production, and this is expected to expand over time. 25 Climate Alliance states and territories are committed to reducing GHG emissions by at least 26 to 28 percent below 2005 levels by 2025.
How can you calculate a carbon footprint?
Whole-farm evaluation or assessment tools have been developed to help farmers calculate their farm’s carbon footprint and GHG emissions based on their management practices, the biological processes that occur on the farm as a result of these practices, and the influence of local climate conditions. Ideally, an initial assessment sets the “baseline” footprint of the farm; the starting point based on the current situation. This baseline can be used to identify emission “hot-spots,” and when combined with information on the farm’s management practices, emission reduction opportunities can be identified, and reduction targets and strategies set. Annual assessments should then be used to monitor progress over time, along with the impact of any management changes.
This type of whole-farm carbon footprint assessment not only allows a farmer to understand their farm’s GHG emissions, but also to develop effective mitigation strategies, sustain farmlands, and provide a means to communicate or report its performance to key audiences, such as consumers, milk processors, retailers, and governing bodies. It may also allow entry into niche or price-premium markets. Though not always the case, farmers may find additional benefits from carbon footprint assessments. For example, the opportunities to reduce GHG emissions may also reveal opportunities to reduce costs and increase productivity. Other benefits include reducing soil erosion and degradation, reducing phosphorus and nitrogen runoff, improving water quality and retention, controlling air pollutants (e.g., ammonia and hydrogen sulfide), and increasing soil fertility. This will have both a positive impact on the environment, in addition to increasing resilience of farms against the effects of climate change.
What information is needed to calculate a carbon footprint?
When calculating carbon footprints, it is important to establish the boundary for the assessment – what is and isn’t going to be included. GHG emission sources can then be classified as direct or indirect. Direct emissions are owned or controlled by the farm (e.g., methane emissions from enteric fermentation). Indirect emissions are not controlled or owned by the farm, but a portion of these emissions are a consequence of the activities on the farm (e.g., those associated with the production of feed and fertilizer that they import and use on the farm). Emissions are also split into three more categories, referred to as “scope.” The first category (scope 1 emissions) include all direct emissions, the second category (scope 2 emissions) include the generation of electricity, heat, or steam that is purchased by the farm, and the third category (scope 3 emissions) are all other indirect emissions (e.g., emissions associated with the production of feed and fertilizer that they import and use on the farm - “upstream emissions” and the emissions associated with packaging, transport and retail of milk, and disposal of the final product waste materials - “downstream emissions”).
The movement of carbon into and out of carbon stores (sometimes referred to as pools or stocks) must also be reported. The capture and long-term storage of carbon will be an important route to reaching net zero. Carbon capture (sometimes referred to as carbon sequestration) and carbon storage take into account emissions and removals associated with land use change within the last 20 years. This includes both the conversion of land between land use categories, and a change in tillage practices. The burning or liming of land prior to conversion must also be included. The removal of carbon dioxide by woody vegetation (e.g. trees, hedgerows) is an example of carbon capture or sequestration into long-term carbon storage and should be included in the assessment. However, the carbon dioxide removed by herbaceous vegetation (e.g. crops, grasses) cannot be included in the assessment as the carbon storage is only short-term. It is important to remember that no carbon storage is permanent, as any soil disturbance or removal of vegetation can release the stored carbon.
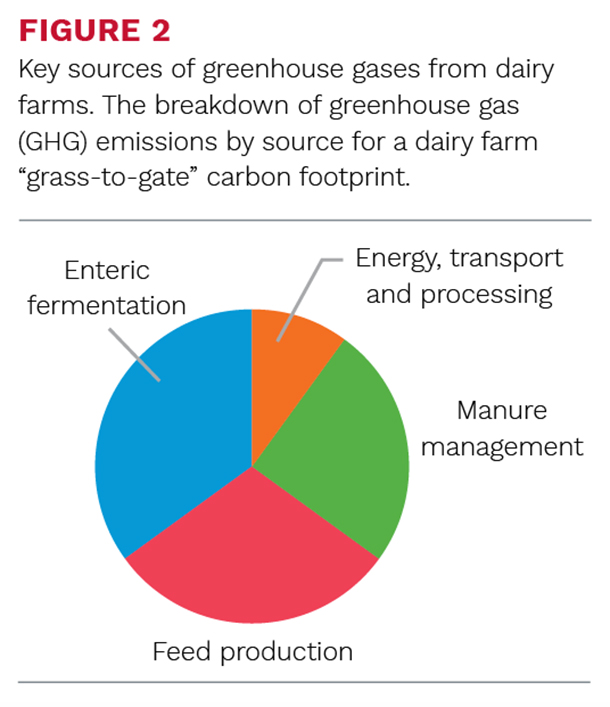
It is routine to conduct a carbon footprint assessment on dairy farms “from grass to gate” which includes all scope 1 and 2 emissions, and “upstream” scope 3 emissions (Figure 1).
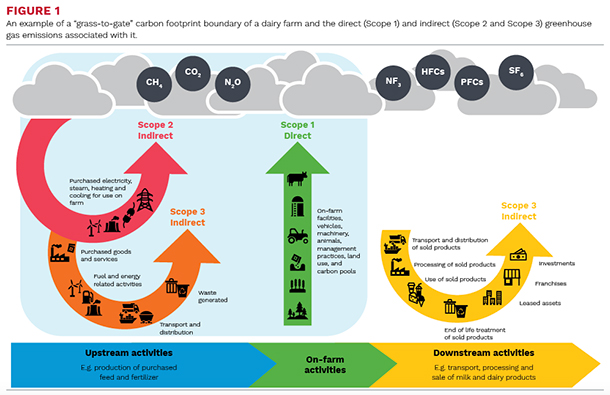
This covers the manufacture and transport of cropping inputs (e.g., fertilizer, herbicides, pesticides, and any water used for irrigation), through feed production (including production of imported feed), and ending with milking of the cows and milk storage until it leaves the farmgate. Transport, processing, and retail of the milk (“downstream” emissions) are not included in the farm carbon footprint. Emissions relating to any by- or co-products (such as crop by-products sold, animals moving into the beef sector, etc.) should not be included in the farm’s milk carbon footprint.
The Cool Farm Tool
The Cool Farm Tool is an example of a whole-farm assessment tool or calculator that is being developed for use on a wide range of farming systems globally. It estimates on-farm greenhouse gas emissions and soil carbon sequestration, and it has been adopted by a range of multinational companies. To date, there has not been robust testing of the tool’s suitability for use in U.S. dairy systems, and users in both the U.K. and U.S. have identified limitations in the current version. However, Cool Farm Tool is under continuous development based on feedback from users, and improved input options are being included as reliable science and data become available at regional levels.
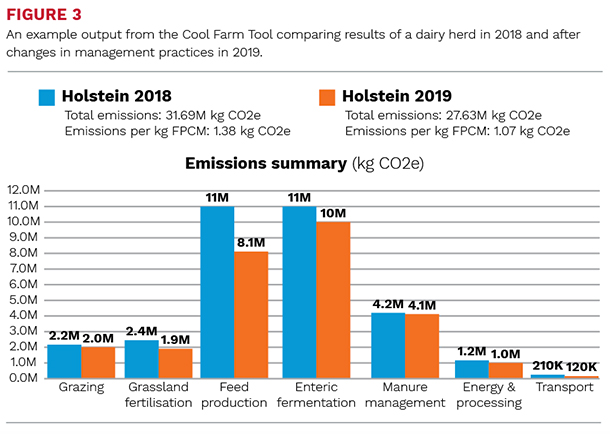
The dairy module calculates the GHG emissions as a total for the whole farm, and on a unit of fat- and protein-corrected milk (FPCM) produced basis to allow comparison between farms. The FPCM adjusts the milk production to a standard with four percent fat and 3.3 percent true protein. The carbon footprint of each feed crop produced on-farm is calculated per unit of crop, and per unit area, with emissions allocated to co- and by-products as necessary.
The crop carbon footprint takes into account fertilizer production and use, energy use, soil characteristics (texture, organic matter content, moisture, drainage and pH), any land use change, tillage practices, crop residue management, wastewater management, and pesticide emissions. The overall milk carbon footprint for the farm includes these feed crop production emissions, in addition to the emissions relating to grazing management, feeding practices (including feed production emissions for imported feed), enteric fermentation, manure management, machinery use and energy, and transport. Emissions related to the use and application of manure are attributed to the crop.
The Cool Farm Tool allows a farm to simulate changes to their management practices to see effects on the carbon footprint results. There is also an option to add economic information for the farm, which provides additional insight into potential benefits and trade-offs any management changes may have, including the financial impact of those changes. Although this will not indicate any effects on productivity, it will allow a farmer to compare the potential gains and trade-offs for different strategies and pick those most suited to their farm and targets.
The main drawback of the Cool Farm Tool, as is the case of most farm assessment tools, is that the evaluation is based on what was done in the previous year. Therefore, it can be laborious to collect the required data for the first assessment, and some data may be missing and must be estimated. During the initial assessment, it is worthwhile to make notes of the missing data to ensure it is collected in subsequent years, and then develop an efficient method of recording the required data throughout the year. Any assumptions made in the first year need to be clearly documented, and corrected when possible, or taken into account when comparing footprints in future years, or with other farms.
Conclusion
The need is growing for U.S. dairy farms to calculate and reduce their carbon footprint to meet the Net Zero Initiatives set by the Innovation Center for U.S. Dairy, in addition to other global, regional, and state climate change targets, requirements set by individual retailers, and satisfaction, or approval, of consumers.
The Cool Farm Tool is a freely available, globally recognized whole-farm evaluation tool that can calculate the emissions of a dairy farm, identify emission hot spots, run scenarios to determine the best mitigation opportunities, and track progress over time. These opportunities often have additional benefits for the farm, including increased productivity, greater resilience to the effects of climate change, and improved bottom lines. We will test this and several other GHG footprint tools on N.Y. dairies over the next two years and will report what we learn in future articles.
Olivia Godber is a post-doctoral research associate with Cornell’s Nutrient Management Spear Program. Karl Czymmek is a specialist with Cornell CALS PRO-DAIRY.
This article appeared in PRO-DAIRY’s The Manager in March 2021. To learn more about Cornell CALS PRO-DAIRY program, visit PRO-DAIRY Cornell CALS.

