


Some dairy farm teams are working with their milk co-op, processor or advisor to develop a greenhouse gas (GHG) or “carbon” footprint. The footprint includes a GHG intensity score (emissions per unit of fat and crude protein-corrected milk) and an estimate of total GHG emissions (total emissions for the farm). What do these numbers mean and how can you make decisions based on the results of footprinting tools currently on the market?
We believe that every dairy farm can benefit from developing a GHG footprint. Annual footprinting will help farmers keep their dairy business current as value chains increasingly ask for this information. Annual reports may also help a farm identify drivers for emissions and ways to reduce them.
It makes sense to engage in the footprinting process early and often. Many farmers find that fine-tuning their recordkeeping systems help them collect data more efficiently and accurately so that results better represent their farm. This can take two consecutive years of data collection and discussion of the results with an experienced evaluator.
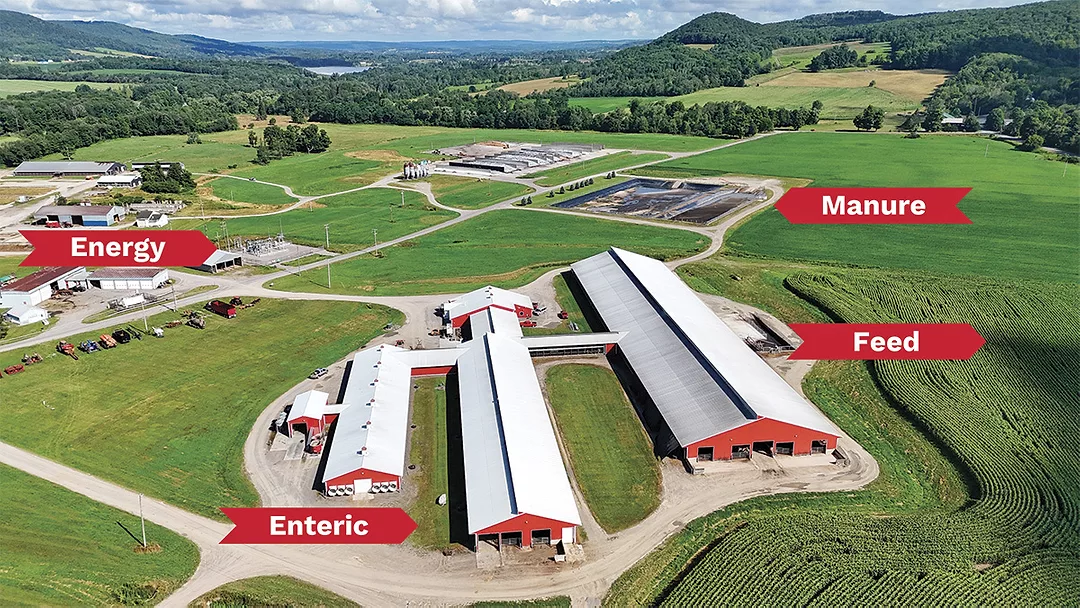
The dairy GHG footprint consists of five categories of information based on emission sources:
- Enteric (the cow)
- Manure treatment and handling (on the dairy)
- Feed production (purchased feed and on-farm produced feed, impacted by manure allocation, fertilizer use, tillage practices, and crop residue)
- Grazing
- Fuel, energy, and trucking
At the present time, the various GHG emission tools are in reasonable agreement on enteric and manure emissions. Typically reported numbers vary in the range of 25 to 50 percent of the total emissions for enteric and 10 to 40 percent for manure across tools and farming operations. Feed production emissions may range between 10 and 50 percent of the footprint. Fuel, energy, and transport tend to be less than five percent. While scientific studies are ongoing and tools will need to advance over time, what can the dairy farmer do to reduce the GHG footprint?
HOW TO REDUCE A FARM’S GHG FOOTPRINT?
Outstanding animal care resulting in increased milk and component production per cow, especially while increasing feed efficiency, is a great way to improve profitability and reduce emissions per unit of fat and crude protein-corrected milk.
Enteric emissions consist of methane produced in the rumen during digestion. The amount of methane produced by a cow largely depends on feed intake, ingredients, and quality. Enteric emissions from the cow are fairly well understood and easily calculated or modeled (the software your nutritionist uses to build diets may already do this). Research is underway to gain greater confidence in the true impact of promising feed additives over the life of a cow and to derive models or equations that accurately represent emission reductions when the additives are used in a dairy diet.
Nitrous oxide and methane from dry lot housing or manure storage systems contribute to manure-related emissions. Proper balance of dietary N reduces urinary N and that means less nitrogen is available for conversion to nitrous oxide. Practices that reduce the amount of manure solids in liquid storage, such as liquid-solid separation of manure, reduce methane emissions. A cover and flare system or anaerobic digester will capture and destroy methane, reducing emissions. Advanced manure treatment systems that prevent or destroy GHGs may be an option on some dairy farms.
Feed production emissions can be a challenge to quantify and though models have a process for doing so, there is often a considerable number of assumptions involved. Emissions from homegrown feed production can be more easily estimated than the footprint associated with imported feed. Many dairy farmers won’t know where the various feed imports come from, much less how they were produced or what GHG footprint is associated with them. There is significant opportunity for the dairy feed supply chain to help develop carbon emission factors for feeds commonly purchased by dairy farmers. What is the actual GHG footprint of canola meal from Alberta, corn meal from Nebraska, alfalfa from Colorado, soymeal from Iowa, citrus pulp from Florida? Does the state of origin matter or is one value for an entire country accurate enough?
Current GHG rules also require land use change to be accounted for. Was the farmed land that produced the feed recently converted to crop production from native prairie, long-term fallow grassland or forest or has it been producing crops for decades? If recently converted, loss of carbon resulting from the change of use can have a large impact on the footprint of the feed. Improving land use change quantification and accounting will be necessary as GHG tools evolve.
Despite all these uncertainties, it is clear that one effective way for farmers in the Northeast to reduce their carbon intensity is to grow as much feed as possible on the farm itself and optimize manure rate and timing for best crop uptake. Using manure to offset fertilizer needs lowers the GHG footprint associated with production and use of N fertilizer. Reduced tillage, continuous no-till and cover cropping are also ways to reduce the footprint.
It is often said that all models are wrong, but some are useful. Models are increasingly important for managing dairy and livestock farms and scientific advances will result in improvements over time. Animal nutrition models like the Cornell Net Carbohydrate and Protein System (CNCPS) used to prepare diets for millions of dairy cattle in the U.S. and globally, have advanced through research over several decades, and it is no surprise that GHG models will need to follow a similar course. Dairy GHG models currently available for use are actively evolving, seeking input from scientific advisory boards, farmers, and advisors.
SO, WHAT IS A FARMER TO DO?
At the present time, it is not feasible to conduct actual, real-time, measurement of GHG emissions across a dairy farm and across time. Using models allow us to improve farm recordkeeping systems to make footprinting easier to do in the future, help us identify where opportunities for improvements in management may be, and if we are moving in the right direction.
Bottom line: Every dairy should have an annual GHG footprint. Work with dairy representatives or other advisors to understand data collection needs and adjust recordkeeping systems to make a year-end summary as easy as possible. As tools evolve and improve, continue to work on milk and crop production efficiency, as both will reduce your GHG intensity.
| This article appeared in PRO-DAIRY's The Manager in March 2026. To learn more about Cornell CALS PRO-DAIRY, visit PRO-DAIRY. |

