


December 2019 production rose 0.7% compared to December 2018, according to the USDA’s monthly Milk Production report, released Jan. 23. Based on that preliminary estimate, monthly year-over-year production grew 0.9% or less in 10 of 12 months during 2019.
December’s restrained growth was due to a slowdown in the increase in milk production per cow. And, cow numbers were unchanged from a month earlier, although the USDA again adjusted cow numbers higher for two previous months for both the U.S. and the 24 major dairy states.
Since bottoming out in June, U.S. cow numbers are now up 37,000 head in the 24 major dairy states. Since August’s low, U.S. cow numbers are up 22,000 head.
December 2018-19 recap at a glance
Reviewing the USDA preliminary estimates for December 2019 compared to December 2018:
- U.S. milk production: 18.28 billion pounds, up 0.7%
- U.S. cow numbers: 9.339 million, down 14,000 head
- U.S. average milk per cow per month: 1,957 pounds, up 16 pounds
- 24-state milk production: 17.44 billion pounds, up 0.9%
- 24-state cow numbers: 8.814 million, up 16,000 head
- 24-state average milk per cow per month: 1,978 pounds, up 14 pounds
Source: USDA Milk Production report, Jan. 23, 2020
Cow numbers up since summer
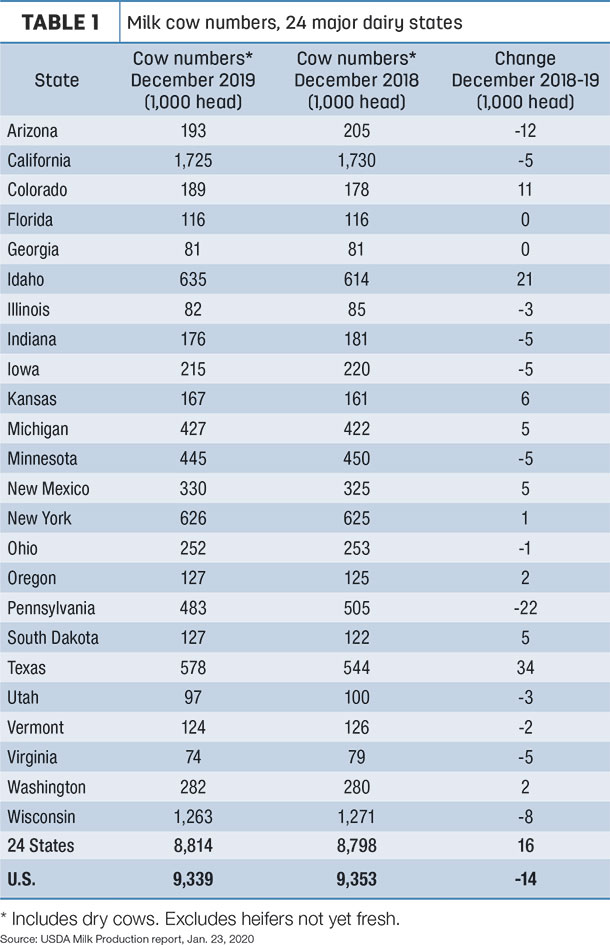
Compared to a year earlier, December’s cow numbers were down 14,000 nationally, but up 16,000 in the 24 major dairy states.
Compared to a month earlier, U.S. and major dairy state cow numbers were unchanged but, in a repeat from last month, November 2019 U.S. and major state cow numbers were revised upward by 8,000 and 4,000 head, respectively.
Three states – Texas, Idaho and Colorado, up a combined 66,000 head from a year earlier – continued to pace growth in cow numbers (Table 1). Kansas, Michigan, New Mexico and South Dakota were up a combined 21,000. In contrast, cow numbers declined in 12 states, led by Pennsylvania (-22,000), Arizona (-12,000) and Wisconsin (-8,000).
Compared to a month earlier, producers in Texas added 4,000 cows, with Kansas up 2,000 head. Producers in Pennsylvania and Wisconsin reduced herds by 2,000 head each, according to the USDA.
Milk per cow increase weaker
Looking at December’s preliminary estimates, year-over-year monthly growth in milk per cow slowed to about one-half pound of milk per cow.
Cows in 15 states yielded higher milk output per cow in December compared to the same month a year earlier (Table 2). Biggest gains were in Virginia and Pennsylvania (up 55 and 50 pounds, respectively). Cows in Oregon and Washington averaged declines of about 25 pounds each compared to December 2018.
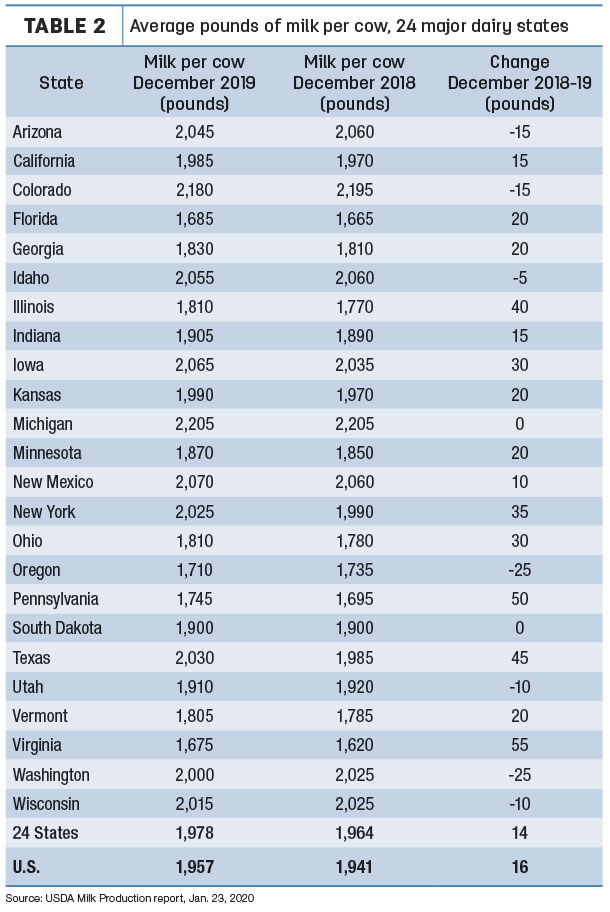
At 2,205 pounds, Michigan continued to be the national leader in milk output per cow on a monthly basis.
Among all major states, Texas led in terms of milk volume and percentage growth in December 2019, up 93 million pounds (8.6%) from a year earlier.
Idaho production was up 40 million pounds (3.2%), and California output was up 16 million pounds (0.5%).
Wisconsin milk production was down 29 million pounds, a 1.1% decline. Arizona production was down 27 million pounds (-6.4%), and Pennsylvania production was down 13 million pounds (-1.5%).
First look at year-end totals
Based on the preliminary full-year estimates, U.S. milk production totaled 218.3 billion pounds in 2019, up 0.3% from 2018. Cow numbers averaged 9.332 million head for the year, down 67,000 head from 2018 and the smallest U.S. herd since 2016. Output per cow averaged 23,395 pounds, up 246 pounds.
In the 24 major dairy states, U.S. milk production totaled 208 billion pounds in 2019, up 0.6% from 2018. Cow numbers averaged 8.797 million head, down 33,000 head from 2018 but still the second-highest total in the past decade. Output per cow averaged 23,647 pounds in 2019, up 240 pounds from 2018.
Progressive Dairy will provide analysis of national 2019 milk production, cow numbers and milk output per cow estimates when they become available from the USDA, and Progressive Dairy’s annual dairy statistics poster will be available in the April 1, 2020, issue of the magazine.
Cropp and Stephenson: Keep an eye on spring flush
Following the USDA’s monthly Milk Production and Cold Storage reports, Mark Stephenson, director of dairy policy analysis, and Bob Cropp, dairy economics professor emeritus at the University of Wisconsin – Madison, provided an overview of dairy markets in their monthly podcast.
Stephenson said cold storage data from the end of December showed that while cheese inventories shouldn’t be considered tight, they were moving more toward “comfortable” levels, helping add some bullishness to the Class III market.
In contrast, year-end butter inventories were up 6% from a year earlier, providing some continued softness to the butter market. That will, however, bring U.S. butter prices in alignment with global prices, which may aid butter exports.
Both Stephenson and Cropp agreed the small increase in milk production will support higher milk prices. December production per cow, up just 0.8%, is likely being held down by forage quality issues.
After deteriorating last month, Class III milk prices “have come roaring back” and are creating opportunities to implement some risk management steps, Stephenson said.
At the close of trading on Jan. 24, Class III futures prices had topped $18 per hundredweight (cwt) in seven months (February, March, April, August, September, October and November).
With the peak cheese-buying season now passed, the next big piece of information affecting the dairy market will be the strength of the spring flush production period, Stephenson said.
“If it’s a big flush, buyers will sit back and wait for prices to go lower,” Stephenson said. “If it feels like it won’t be a big flush, and we aren’t going to build product inventories like we normally do, I think folks are going to step in and buy early.”
For Stephenson, one of the numbers to watch is daily U.S. milk production in April, May and June. A narrow window, between 615 million to 620 million pounds of milk per day, is the hinge point. Production below 615 million pounds per day will create market tightness, above 620 million pounds per day will likely lead to softer prices.
Cropp agreed, and he doesn’t foresee a big spring flush coming. He questioned the latest USDA outlook forecasting a 1.7% milk production increase in 2020. Cropp said he believes that outlook is overstating milk production growth, and that feed quality challenges will restrict any large increase in milk production per cow. He also expects dairy farmers to continue to exit the business.
Other factors with a positive influence on dairy markets include strong U.S. cheese exports and softer global milk production. A cloud is the possibility of a global recession.
Cropp is sticking to his more optimistic milk price outlook. He sees first-quarter Class III prices in the strong $17s, reaching high $17s and $18s in the second quarter, and maybe even $19 per cwt by the end of the year.
That results in a 2020 Class III average of about $18.15-$18.20 per cwt, which would be $1.20-$1.30 higher than the average in 2019.
Cropp said any influence of recent trade agreements will be longer term and won’t have a big impact on 2020 prices. ![]()

-
Dave Natzke
- Editor
- Progressive Dairy
- Email Dave Natzke


