


Last year, the USDA released the 2017 Census of Agriculture. The agriculture census is taken every five years going back to 1840. Many, including me, filled out and returned a 2017 census form, providing information about our farming operations.

The vast amount of data collected has many uses, such as developing policy and programs including disbursement of government funds, identifying trends and helping to more efficiently allocate resources.
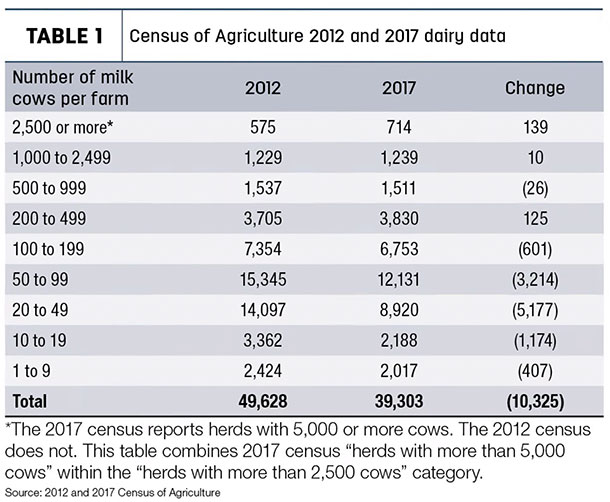
The 2017 agriculture census reports 2.04222 million total farms, about 67,000 fewer farms than reported in the 2012 census. More than 39,300 of these farms, or about 2 percent of all farms, had milk sales as of Dec. 31, 2017. This is 10,325 fewer dairy farms than compared to the 2012 census (see Table 1). Most of the decline in herd numbers is from farms with fewer than 100 cows, while those with more than 1,000 cows are expanding. Since 1992, the number of farms with more than 1,000 cows has increased from 564 to 1,953.
The census groups the 39,303 farms by herd size, from over 5,000 cows down to one to nine cows per farm. The year of 2017 is the first time their data has included the “over 5,000 cows” category. Milk sales are reported for each herd size as well (see Table 2). I have added descriptive statistics to show the relationship of each herd size to the total number of farms and sales.
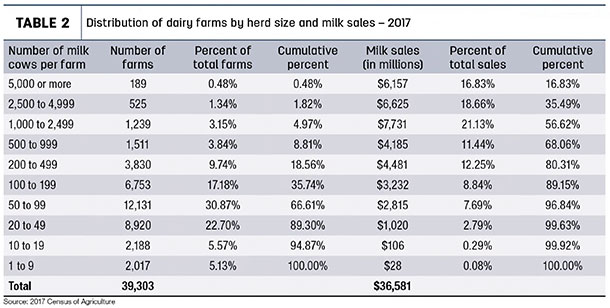
Let’s walk through Table 2 for the 200 to 499 cows per farm group to understand what the data is telling us. The 2017 census reports 3,830 farms with 200 to 499 milk cows. Column three shows farms falling within the 200 to 499 herd size are 9.74% of all farms with milk cows. Column four is the cumulative percent. This tells us all farms with 200 or more cows are 18.56% of the 39,303 dairy farms.
80-20 rule
Going on across the table, we see the 200 to 499 category had milk sales of $4.481 million in 2017, which was 12.25% of total milk sales as shown in column six. Then the last column shows the cumulative percent of sales. All farms with more than 200 milk cows were responsible for 80.31% of total milk sales.
Putting it in simple terms, 7,294 farms or 18.56% of total dairy farms (farms with 200 or more cows) generated 80.31% of the milk sales in 2017. Dairy is following the 80-20 rule: 80% of milk sales come from 20% of the farms. Or taking it a step further, 14,047 farms (farms with 100 or more cows) generate 89.15% of total milk sales. The nation’s dairy industry is getting closer to 10,000 farms producing most of the nation’s milk production.
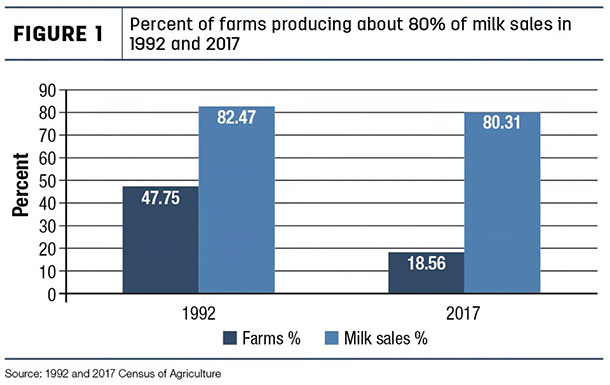
How has this “farm concentration” level changed over time? Going back 25 years to the 1992 census, we see farm concentration was lower. The 1992 census reported 130,279 farms with milk sales. It took 47.75% of the farms to generate 82.47% of milk sales. In short, in 1992, it took about one-half of the nation’s dairy farms to generate 80% of the sales. Twenty-five years later, in 2017, less than 20% of the dairy farms are generating 80% of milk sales (see Figure 1).
Small farms
As stated above, this country is getting closer to 10,000 farms producing most of the milk. However, I do not want to write off small dairy farms. Farms with fewer than 100 cows still comprise about 60% of all farms with milk sales. In some states, farms with fewer than 100 cows are a significant portion of the state’s dairy industry. For example, in Pennsylvania, about 80% of the state’s dairy farms are responsible for about 45% of milk sales.
Helping to support smaller farms are some cooperatives that focus on marketing milk from smaller farms. These cooperatives provide milk markets for smaller producers and are smaller-herd-oriented in their decision-making. In addition, on-farm dairy processing and manufacturing, a growing segment of the dairy industry, is adding some farms. Granted, it is not easy processing or manufacturing, then going out and marketing those products. But it is helping to keep some smaller farms in business and has the potential to help others. Progressive Dairy has provided articles on this subject. However, it goes without saying if dairy margins per pound of milk produced continue to decline, smaller farms face a greater challenge.
In summary, the trend continues toward fewer but larger dairy farms. This is the trend in most all segments of production agriculture, as supported by Census of Agriculture numbers. The merit of fewer but larger farms has and will continue to be debated. But what is not to be overlooked is: The nation’s agricultural industry, including the dairy industry, continues to feed more and more people with fewer and fewer resources consumed.
The U.S. population went from 272.9 million in 1997 to 325.7 million in 2017, a gain of 52.8 million people. Yet during this 20-year period, the acres in farmland dropped from 954.8 million to 900.2 million acres. Today there are about the same number of dairy cows as there were 20 years ago. Fewer cows are providing more dairy products to more people, not only in this country but throughout the world. There appears to be no end to the productivity and efficiency of American farmers.


