Spring always has a way of delivering a mixture of optimism and uncertainty. This year, the impact of all things “coronavirus” is resulting in seaport disruptions and creating volatile waves in trade and financial markets, increasing the level of unpredictability.

Adding some clarity, the USDA is scheduled to release results of its “prospective plantings” survey on March 31, giving some indication of how much acreage will be devoted to hay and forages in 2020. However, as we saw last year, Mother Nature will have the last word.
All that produces our own version of March madness, clouding some of the highly optimistic expectations held just a month ago.
Hay exports at 24-month low
After setting a new record high in 2019, U.S. alfalfa hay export volumes started the new year weaker. And remember, the January numbers reflect sales before the full weight of the coronavirus hit.
January shipments totaled 177,977 metric tons (MT), the lowest monthly total in two years. Japan was the leading market for U.S. alfalfa hay at 54,397 MT. At 47,836 MT, sales to China were the lowest to that country in 11 months. Other leading destinations were Saudi Arabia, South Korea and United Arab Emirates.
Like alfalfa, January exports of other hay were a 24-month low at 105,386 MT. Japan continued to be the leading buyer at 61,679 MT, with South Korea taking 24,681 MT.
Drought areas, moisture conditions
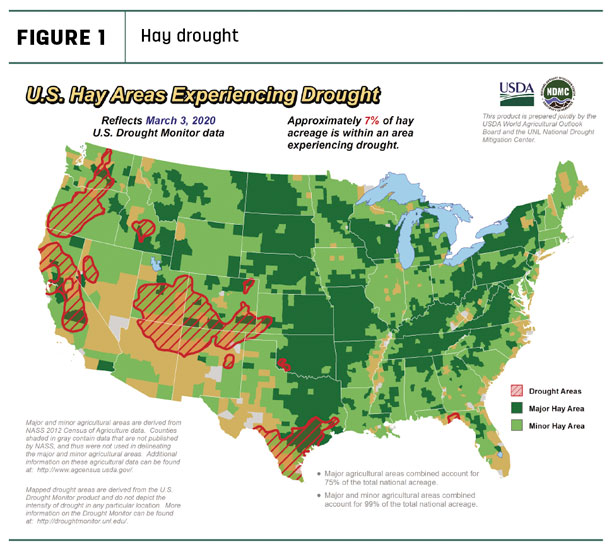
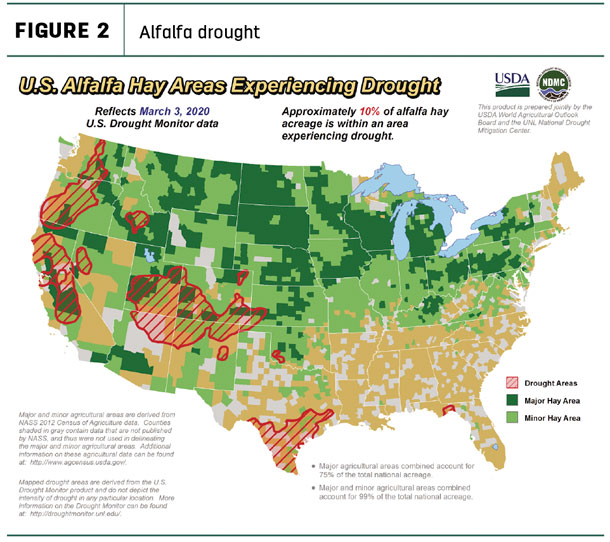
Marching into spring, the news regarding hay-producing areas impacted by drought was mixed. About 7% of U.S. hay-producing acreage (Figure 1) was considered under a drought, a 1% decline from the previous month. At 10%, alfalfa-producing areas under drought conditions increased 3% from last month (Figure 2), with much of the increase coming in central California. Other large dry areas were in southern Texas, southern and western Colorado, central Idaho, Utah, Oregon and Washington.
With few exceptions, the second half of the winter of 2020 has been marked by mild weather, with more days at above-normal – but not necessarily hot – temperatures, according to Eric Snodgrass, atmospheric scientist with Nutrien Ag Solutions.
Accumulated snowfall has been high in the Pacific Northwest but lighter in the northern Rockies and shortest in the Sierra Nevada, resulting in drier soil moisture conditions. The split-flow pattern resulted in the driest February on record for California.
Changing weather patterns indicated moisture could arrive in California in the near term, although it won’t provide a “miracle March,” Snodgrass said in his regular “Weather Insights” video presented by Northwest Farm Credit Services. The emerging pattern, however, indicates lower precipitation delivery in the Pacific Northwest.
According to the U.S Drought Monitor’s High Plains summary, year-to-date precipitation over northeast Colorado was 50% to 65% of normal, and stream flows were running well below normal. Precipitation had effectively erased areas of abnormal dryness, and moderate drought in south-central Kansas helped improve the drought conditions in the western part of the state.
The Northern Plains and Great Lakes faces a different challenge: surplus soil moisture.
January prices summarized
Alfalfa
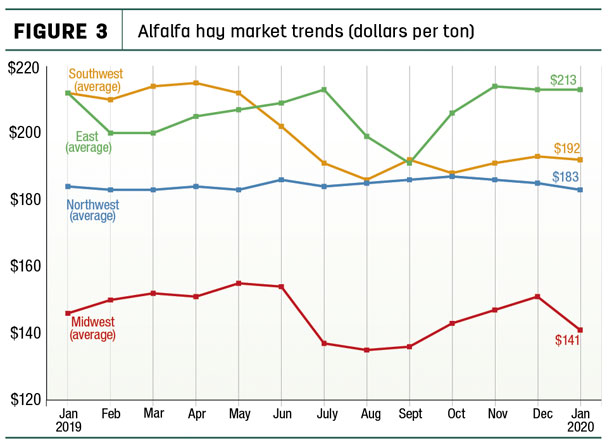
Despite stronger prices for dairy-quality alfalfa in several major milk-producing states, the U.S. average alfalfa hay price softened about $4 per ton in January to $171 per ton. Prices dipped in three of four regions tracked by Progressive Forage (Figure 3).
Pennsylvania ($228 per ton), Colorado ($225) and New Mexico and Ohio (both $220) had the highest prices for the month; lows were in North Dakota ($91) and Nebraska ($103).
Compared to a month earlier, concerns over dairy farm profitability drove alfalfa prices lower in Wisconsin. Compared to a year earlier, average prices were down $30-$45 in Kansas, New Mexico and Oklahoma, but up $35 in Ohio.
Other hay
The U.S. average price for other hay remained fairly steady in January, with small increases in the Southwest and East partially offsetting declines in the Midwest and Northwest (Figure 4).
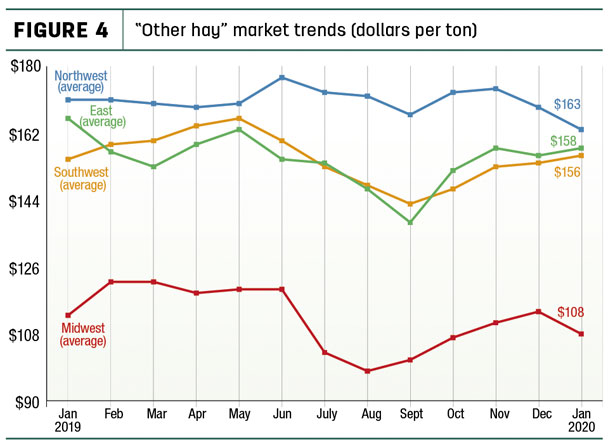
Highest average prices in January were in Colorado ($225 per ton), followed by Arizona ($200). Prices again averaged under $100 per ton in five states: Kansas, Nebraska, North Dakota, Oklahoma and South Dakota.
Compared to a month earlier, prices were strongest in Michigan and Ohio, but weaker in Wisconsin, Oregon and Washington.
Dairy hay
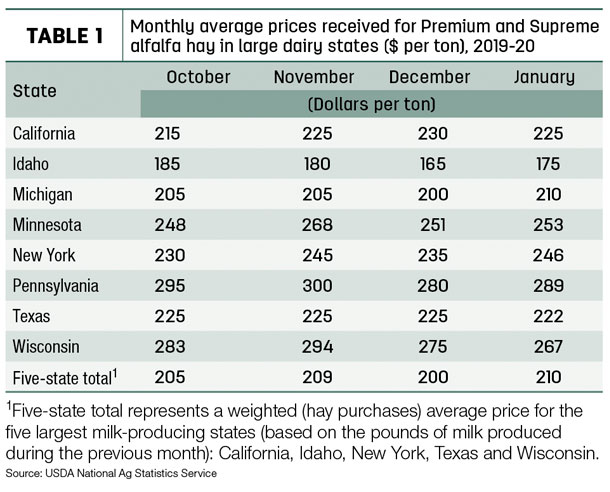
January prices for Premium and Supreme hay in the top milk-producing states averaged $210 per ton, up $10 from December and the highest since June 2019 (Table 1).
Organic hay
No sales price summaries were included in the USDA’s Organic Hay report released in late February.
Regional markets
Here’s a regional summary of early March conditions and markets:
- Midwest: In Nebraska, best demand was for large squares leaving the state. With less dollars going back to the producers, cattle producers appear to be buying hay on an as-needed basis, hoping the weather will stay fairly warm and they will have enough feed on hand to get to summer grass. Warm and windy days were enabling others to bale cornstalks.
In Iowa, prices for dairy-quality hay were stronger but lower for other varieties.
In Kansas, alfalfa prices were steady, with movement slowed for a third straight week in the southwest region.
In Missouri, several new listings of hay were offered as producers look to try to move inventory before new crop hay arrives. After a slow winter for hay sales, supplies were moderate, demand was light to moderate, and prices were steady.
Very little dairy-quality hay exists in South Dakota, which has helped support prices. Abundant supplies of lower-quality hay added substantial price pressure to the market as hay moves east from western parts of the state. Cattle producers have been struggling with profitability and are looking to cheapen their feed costs.
In Wisconsin, prices remained strong for top-quality hay, with good demand for all types of hay at the local markets.
In southwest Minnesota, prices were steady, with a limited supply of hay at the market.
- Southwest: In Oklahoma, hay movement continued very slow. Weaker milk prices reduced demand for alfalfa hay, and most of the alfalfa quoted at the top of the price ranges had to be flawless.
In Texas, hay trade was steady in all regions except for South Texas where trades are firm to $10 higher due to droughtlike conditions along with several days of hard frost. Cattle producers were forced to continue supplemental feeding as pasture conditions continued to diminish. North, central and eastern areas benefited from rain.
In California, trade activity was moderate on moderate demand.
- Northwest: In Montana, all classes of hay sold mostly steady to lower, pressured by large quantities of feeder hay and rounds. Ranchers continued to buy hay on an as-needed basis. Supplies of high-quality hay in squares remained tighter.
In Idaho, demand remained slow as volatile financial markets had most interests uneasy and wondering what was going to happen next.
In Colorado, trade activity was light on light-to-moderate demand. The price spread between dairy-quality alfalfa and grinder hay continued to grow.
In Wyoming, most of the snow at lower elevations had melted, and mud was a common complaint from hay contacts. Most producers are sold out of hay, with a few loads of small squares of alfalfa available. The latest video auction saw Premium to Supreme hay selling steady to higher. Many prospective buyers said they will have enough feed to get to first cutting and didn't jump to stockpile or procure additional feed resources.
In Oregon, prices trended generally steady in a very limited test. In the Washington-Oregon Columbia Basin, all grades of domestic alfalfa were firm.
- East: In Pennsylvania, more hay was offered for sale, with prices steady to lower; large bales of straw and corn fodder sold mostly steady.
In Alabama, hay prices were steady with moderate supply and demand.
Other things we’re seeing
- Dairy cattle numbers a moving target. You’ve read the headlines: The annual average number of U.S. dairy farms commercially licensed to sell milk fell to 34,187 in 2019, a decline of 3,281 (8.8%) from the year before and down 20,755 (37.7%) since 2009. Year-over-year declines were largest in the Midwest and East.
Despite declining herds, cow numbers have been a bit of a moving target of late. The USDA’s latest report revised previous estimates higher for all months going back to September 2019. And, January 2020 cow numbers jumped 5,000 head from December 2019.
Since bottoming out in June, U.S. cow numbers are up 37,000 head in the 24 major dairy states, with most of the growth concentrated in four states – Texas, Idaho and Colorado and New Mexico – and more modest gains in Kansas, South Dakota, Michigan, Washington and Oregon. Pennsylvania, Arizona and Wisconsin led decliners.
-
Cattle markets volatile. Like other markets, cattle markets have seen extreme price moves and incredible volatility as a result of coronavirus concerns and the related impact on financial markets.
- Truck taxes a concern. Several agricultural trade organizations joined forces to urge Senate leaders to stay away from a trucks-only vehicle miles tax (VMT) as Congress seeks ways to fund the U.S. transportation infrastructure.
A recent Congressional Budget Office report estimated the Highway Trust Fund will run out of money in 2022. The report examines one option, the trucks-only VMT, as a revenue source. Kentucky, New Mexico, New York and Oregon already levy such taxes at the state level.
The ag coalition said a trucks-only VMT would increase truck transportation costs and lead to lower farmgate prices and reduced market share for U.S. agriculture.
- Interest rates lower. The Federal Reserve cut its benchmark interest rate in an effort to support the economy in the face of the spreading coronavirus. The one-half percentage point cut lowered the benchmark rate to a range of 1% to 1.25%.
Based on quarterly lender surveys from three major agricultural Fed districts, interest rates on most ag loans were already trending lower at the start of 2020. In the Dallas district, interest rates charged on all variable- and fixed-rate loans were down from the previous quarter, and all were the lowest since the first half of 2018. Interest rates on all categories of variable- and fixed-rate loans in the Kansas City and Chicago districts were down from the previous quarter and in many cases were the lowest since the end of 2017.
Figures and charts
Progressive Forage tracks regional hay price trends using average monthly prices reported for selected states by the USDA’s National Agricultural Statistics
Service (NASS). The USDA report does not provide hay quality classes in its price reports. By region, states included:
- Southwest – Arizona, California, Nevada, New Mexico, Oklahoma, Texas
- East – Kentucky, New York, Ohio, Pennsylvania
- Northwest – Colorado, Idaho, Montana, Oregon, Utah, Washington, Wyoming
- Midwest – Illinois, Iowa, Kansas, Michigan, Minnesota, Missouri, Nebraska, North Dakota, South Dakota, Wisconsin