
“Big data” is a term used to describe the massive amounts of information generated today at ever-increasing volumes and velocities; it is currently estimated that 2.5 quintillion bytes of data are created daily. This is the equivalent of 1.7 megabytes produced every second by every human on earth. In fact, to download all the data stored on the internet, it would take approximately 181 million years (and you thought your internet was slow). What is responsible for all this data generation, you may ask. This is partially explained by the fact that 127 new devices (primarily sensors and modules) connect to the internet for the very first time every second.

The dairy industry is no exception to this phenomenon: think about things like activity collars, smart boluses, robotic milking systems, cloud-based feeding management and handheld near infrared (NIR), to name a few. These devices similarly generate and store multitudinous amounts of data. Even monthly, individual cow testing contributes to the data heap. If this big data concept seems staggering, you are not alone. The ability to aggregate and make sense of this massive amount of data has become a major focus, with 97.2% of business executives reporting that their organizations are investing in big data and artificial intelligence (AI) projects (in fact, the “art” for this article was created by an AI, DALL-E 2). In the dairy industry, we should ask ourselves, how can we make sense of the massive amounts of data generated on our farms to help inform decisions, track progress and, ultimately, improve profitability? This article provides a simple framework to approach big (dairy) data.
Step 1: Decide what is important
The problem with big data is just that; it’s big. It’s easy to become overwhelmed with line after line of information, which can lead to a state of indecisiveness and inaction. When taking advantage of big dairy data, I’ve found it’s best to narrow the focus to metrics that meet several criteria:
- Can the information be accurately and regularly measured?
- Is the information meaningfully related to the dairy’s primary goals?
- Can results be influenced by changes in management or nutrition?
- Is a positive or negative result detectable with reasonable certainty?
You really must sort the data out and prioritize what you want to spend time on because there is a lot of noise that we see in the data from day-to-day. If we can dig deeper into the data we want to use, we can ensure it is correct and sort it down and store it. A classic example of data monitoring that is meaningfully related to the dairy’s primary goals is the age-old dichotomy of milk component percent versus pounds of components shipped. While everyone wants to see 4% butterfat (excluding the Jersey folks) on the bulk-tank slip, what we’re truly paid on is pounds of milk components shipped (in a Class III market). For example, would you rather ship 45,000 pounds of milk with 4% butterfat or 50,000 pounds with 3.8% butterfat (1,800 versus 1,900 pounds of butterfat)? If profitability is a goal, we’re better off setting our benchmark to ship a certain amount of milk components off the farm rather than getting hung up on a specific percentage. This is one example, though there are countless others; decide what is important and narrow the focus to appropriate, meaningful metrics that don’t distract from the bigger picture.
Step 2: Set the bar
After identifying the most important metrics that can be garnered from big data, the second step is to determine related goals. Where should these numbers be for the dairy to be profitable and/or improve key performance indicators? One of the time-tested approaches to goal setting is to use the SMART criteria. Goals should be:
- Specific: well-defined, specifying who, what, where, when and why
- Measurable: uses key indicators that may be collected from the data
- Achievable: can be realistically met and ensures necessary resources are available
- Relevant: aligns with the big-picture goals of the dairy
- Time-based: establish a deadline
A helpful exercise may be to sit down with your nutritionist, veterinary staff, repro team and key employees to discuss primary opportunities for the dairy and determine realistic goals using SMART criteria. The group should reconvene regularly to hold each party accountable for meeting these goals. If not yet achieved, discuss the progress that has been made and schedule activities essential for continuing to advance toward meeting them.
Unsure where certain goals should be set? Benchmarking may be a helpful strategy to compare key performance indicators of your herd versus herds of similar size, composition and region. Farm financial consultants often share anonymized economic key performance indicator (KPI) rankings with clients, which may be a good place to start. Similarly, nutrition consulting firms will sometimes track milk production performance across clients for the purpose of benchmarking. For example, our company has developed a record manager platform whose database will soon surpass 10,000 test day evaluations encompassing millions of individual cow records. The platform allows for summary reports to be generated by filtering for specific date ranges, regions of the U.S., breeds of cows, housing types and milking frequencies. If using benchmarking to help determine goals, it is important to be cognizant of potential differences across herds, such as breeds of cows or milking frequency, which may skew what is realistic or attainable for the dairy.
Step 3: Collect, analyze, repeat
Once specific goals are in place, the final step is to collect and analyze the data on a regular, recurring basis. Dairies are really looking for talented people to dissect and analyze the data, prove it and reevaluate, which is an ongoing process.
Perhaps the greatest challenge of big data is aggregating it from multiple sources, linking meaningful metrics and making sense of how they are related to “prove” progress toward goals. On a dairy farm, it is very possible for data generation to occur across five or more platforms, such as herd management software, feed management software, parlor software and activity monitoring software. Compounding the challenge, it is uncommon for all of this software to “talk” to one another, let alone run on the same machine. This is where good data collection and analytics come into play. Aggregating meaningful data from across platforms into a simple, centralized location, such as a spreadsheet, allows for a narrowed focus and simplified tracking across time. For example, the format can be as simple as the example in Table 1 and can be expanded for additional categories, including, repro, health, etc.
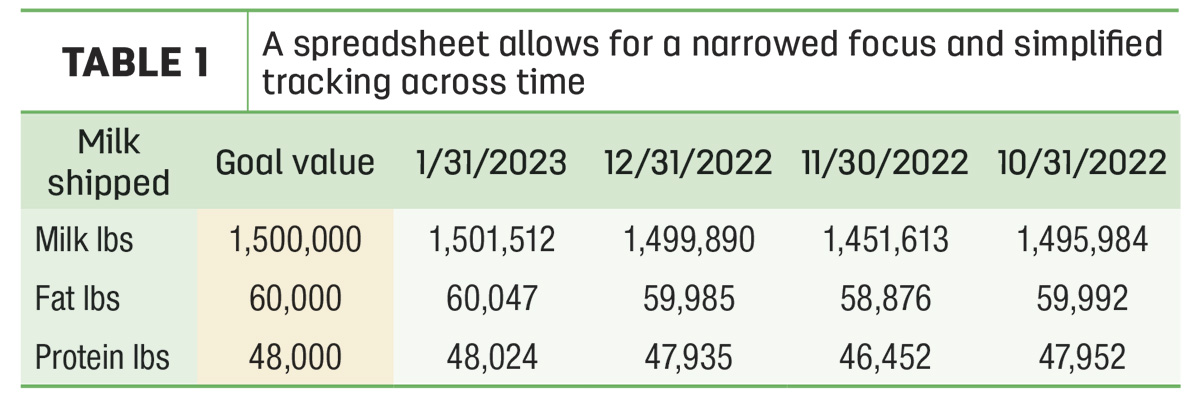
It is also important to consider a format that best matches the “learning style” of the readers. For example, some prefer data in tabular form like Table 1, while visual learners prefer graphical representations of the information. Choose the format that promotes meaningful conclusions to be easily gleaned by the target audience. Often, this will involve both report types, tables and graphs.
Collecting and storing data in one easy-to-read location can go a long way to cut to the core of the voluminous data generated on a dairy. Additionally, repeating the data summary at regular intervals over time allows one to more easily identify trends and look back at historical performance. Information from the past can help to explain the present and demonstrate obstacles for the future (i.e., weather, stocking rates, herd profile).
With the exponential growth in technology we’ve experienced this century, we’re undoubtedly generating more data on our dairy farms than we ever have before. While it can sometimes feel like the amount of data we have access to surpasses our ability to interpret it, taking steps to filter through the noise, set goals and analyze progress allows us to harness the information in a way that informs productive and profitable decision-making.
References omitted but are available upon request. Click here to email an editor.