


Update highlights

- February cull dairy cow marketing steady
- All-milk, mailbox price spread narrowed in December
- Dairy product inventories mixed
- January 2023 fluid milk sales lower but organic sales improve
- Vitaliano: March dairy outlook
February cull dairy cow marketing steady
Stronger beef prices and high feed costs helped maintain the pace of dairy cull cow marketing in February, even as the U.S. dairy herd grew.
The number of dairy cull cows marketed through U.S. slaughter plants was estimated at 266,500 in February, down 31,400 from January due to fewer slaughter facility operational days. With 24 non-holiday weekdays and Saturdays, slaughter averaged 11,100 head per day.
The USDA estimated there were 9.417 million dairy cows in U.S. herds in February, up 12,000 from January and putting the February culling rate at about 2.8%.
Heaviest dairy culling during February occurred in the Southwest (Arizona, California, Hawaii and Nevada) and Upper Midwest (Illinois, Indiana, Michigan, Minnesota, Ohio and Wisconsin).
Primary data for the USDA’s Livestock Slaughter report is obtained from reports from about 900 federally inspected plants and nearly 1,900 state-inspected or custom-exempt slaughter plants.
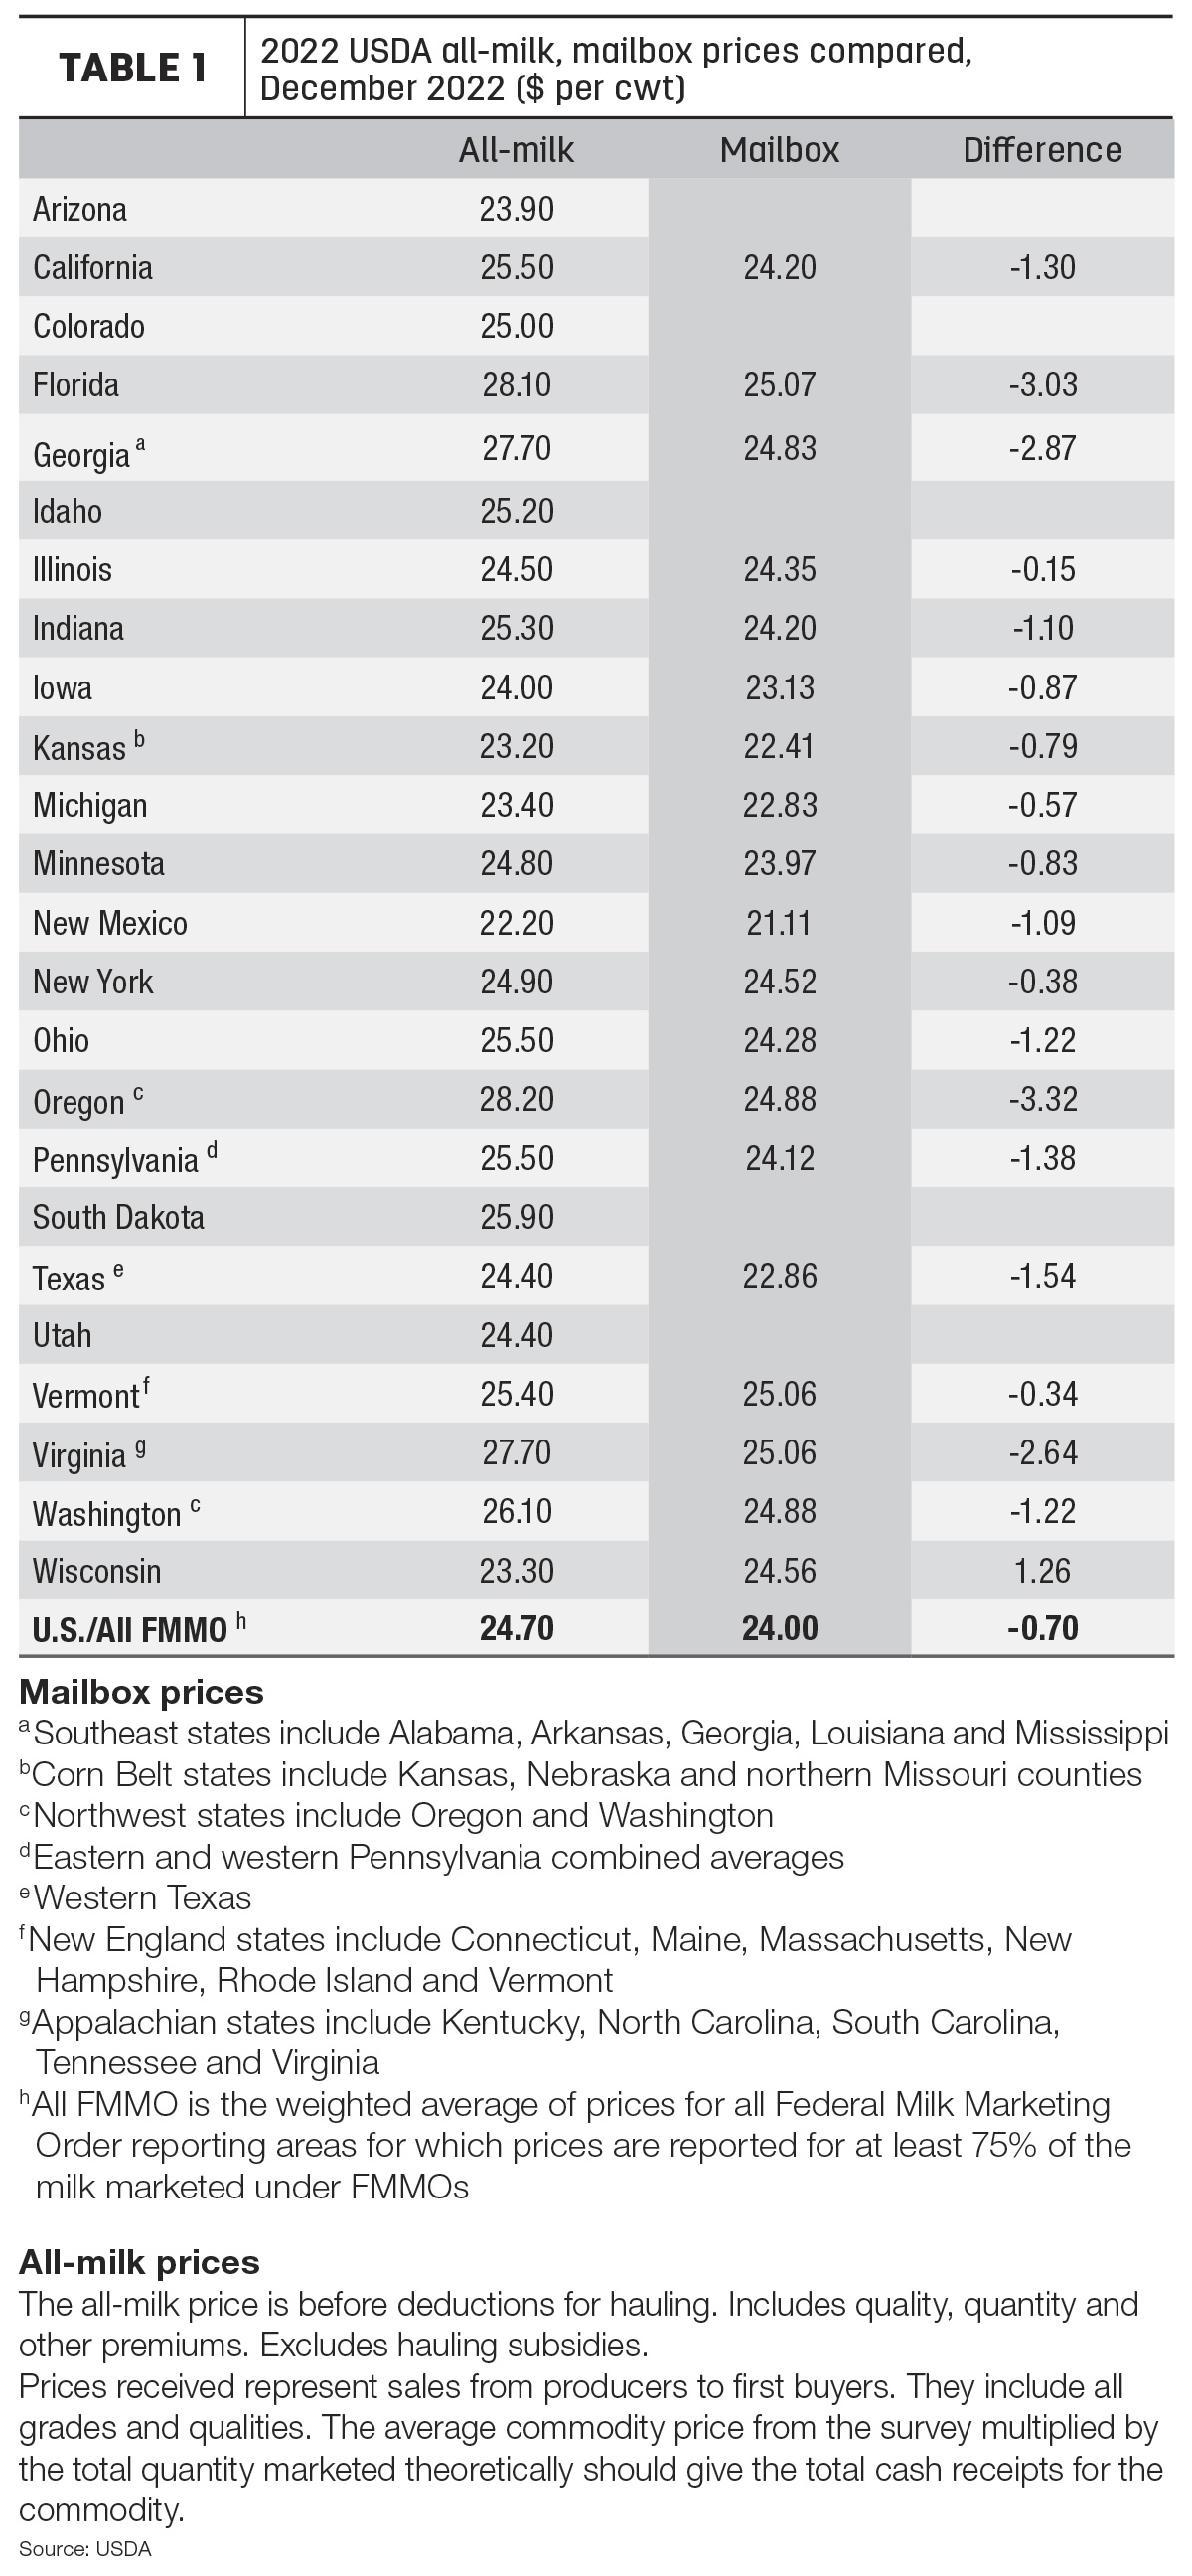
All-milk, mailbox price spread narrowed in December
The gap between December 2022 average “mailbox” prices and the comparable “all-milk” prices narrowed to about 70 cents per hundredweight (cwt), in part due to a price inversion in Wisconsin. Based on a preliminary look at two USDA milk price announcements:
- During December, U.S. all-milk prices averaged $24.70 per cwt, down 90 cents from November 2022.
- The December 2022 mailbox prices for selected Federal Milk Marketing Orders (FMMOs) averaged $24 per cwt, down 61 cents per cwt from the month before.
The December spread between individual states or regions again varied widely, with a difference of about -$3.03 per cwt in Florida to +$1.26 cents per cwt in Wisconsin (Table 1).
All-milk prices are reported monthly by the USDA National Ag Statistics Service (NASS). The all-milk price is the estimated gross milk price received by dairy producers for all grades and qualities of milk sold to first buyers, before marketing costs and other deductions. The price includes quality, quantity and other premiums, but hauling subsidies are excluded.
The mailbox price is the estimated net price received by producers for milk, including all payments received for milk sold and deducting costs associated with marketing. Mailbox prices are reported monthly by the USDA’s Agricultural Marketing Service (AMS) and generally lag all-milk price announcements by a month or more.
The price announcements reflect similar – but not exactly the same – geographic areas.
The difference in the two announced prices can affect dairy risk management, since indemnity payments under the Dairy Margin Coverage (DMC) are based on the all-milk price, while Dairy Revenue Protection (Dairy-RP) and Livestock Gross Margin for Dairy (LGM-Dairy) programs are based on FMMO class and component prices.
Dairy product inventories mixed
Cheese inventories in cold storage were down slightly to end February, while supplies of butter were up. According to the USDA’s monthly Cold Storage report, released March 23:
- Total natural cheese stocks were estimated at about 1.45 billion pounds, unchanged from January and down 1% from February 2022.
Stocks of American cheese were estimated at about 816.9 million pounds, down 1% from the previous month and down 2% from the previous year.
- Butter stocks were estimated at 295 million pounds, up 12% from both January 2023 and February 2022.
January 2023 fluid milk sales lower but organic sales improve
Fluid milk sales started the new year as they ended the last one, trending lower. Here’s an update on U.S. fluid milk sales data from the USDA AMS for January 2023.
- Total sales: Sales of packaged fluid milk products totaled about 3.79 billion pounds, down 0.6% from the same month a year earlier.
- Conventional products: Monthly sales totaled 3.53 billion pounds, down 1% from the same month a year earlier.
- Organic products: January sales totaled 258 million pounds, up 4.8% from a year earlier. Organic represented about 6.8% total fluid product sales in January.
U.S. figures are based on consumption of fluid milk products in FMMO areas, which account for approximately 92% of total U.S. fluid milk sales, and adding the other 8% from outside FMMO-regulated areas. Sales outlets include food stores, convenience stores, warehouse stores/wholesale clubs, nonfood stores, schools, the food service industry and home delivery.
Vitaliano: March dairy outlook
Export growth was able to more than make up for the loss in domestic use and keep total commercial dairy use (domestic and exports) positive during November 20222-January 2023, according to National Milk Producers Federation’s Peter Vitaliano.
Summarizing dairy markets in the March 2023 Dairy Management Inc./National Milk Producers Federation Dairy Market Report, he said milk and dairy product prices have receded from their often record levels last year, with the U.S. average all-milk price falling from its all-time record high of $27.30 per cwt last July to $23.10 per cwt in January. At the same time, feed costs measured under the under the DMC program have stayed mostly in the high $14 per cwt to low $15 per cwt range, squeezing producer margins. DMC margins are expected to remain below the maximum $9.50 per cwt DMC coverage level until the fourth quarter of this year.
For more information on commercial use, dairy trade, milk production, product inventories, prices and margins, click here.

