


What will 2015 farm milk prices look like? This is a question asked by many dairy farmers. The USDA’s November 2014 outlook projects the 2015 all-milk price to average $19.40 per hundredweight (cwt), which is about $5 per cwt lower than 2014.

The CME futures market, as of Nov. 21, 2014, shows the 2015 Class III and Class IV prices averaging $17.01 per cwt and $16.12 per cwt, respectively. This is $5.50 to $6 per cwt lower than 2014. The common denominator among 2015 milk price projections is that prices will be lower than 2014, but the big question is: How much lower?
There are several milk price indicators, but I see three as the most important in looking at 2015 milk prices. They are: number of dairy cows and resulting milk production; commercial disappearance (demand) of dairy products, both domestic and exports; and stocks or inventory of cheese, butter and powder.
Each month the USDA publishes numbers for each of these indicators, making it easy for dairy farmers to follow. This article looks at these indicators and what they are telling us in regard to milk prices in 2015.
Number of dairy cows
My first indicator is number of dairy cows and the resulting milk production. The number of dairy cows in the U.S. reached a low of slightly more than nine million head in 2004. Cow numbers then increased to 9.315 million head in 2008 (See Figure 1).
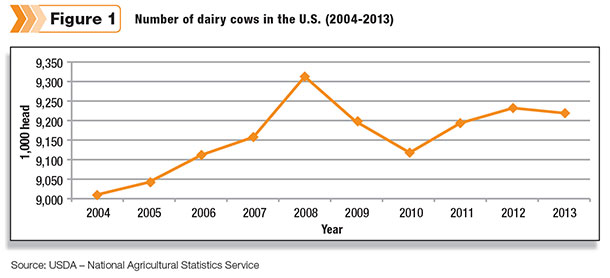
We know what happened to milk prices the following year. Since 2010, except for a slight dip in 2013, the nation’s dairy herd has expanded. From 2010 to 2013, the nation’s dairy herd expanded by more than 100,000 cows.
During the past year the nation’s dairy herd has expanded more rapidly. From November 2013 to October 2014, dairy farmers added 69,000 head to their milking strings. More impressive, this expansion occurred during a period of record-high cull cow prices.
Translating these additional cows into pounds of milk, every 50,000 cows added increases the nation’s annual milk production by 1.2 billion pounds. This is an increase of more than 0.5 percent in annual U.S. milk production.
What do cow numbers tell us about 2015? Unless dairy farmers starting culling more cows, and milk produced per cow happens to decline (only happened once in the past 13 years), the expansion in cow numbers means more milk.
More cows, along with normal increases in milk produced per cow, indicates at least 2 percent more milk in 2015 compared to 2014. If the nation’s dairy herd continues to keep expanding over the next few months as it has during the past year, the increase can easily be more than 2 percent, which could push milk prices lower in 2015 than the numbers given above.
It goes without saying that the higher the milk production increase, the more downward pressure on milk prices. The one thing that can change this is demand for the additional milk production, which leads to the second indicator.
Commercial disappearance
Commercial disappearance, both domestic and export, is the second key indicator to watch in regard to 2015 milk prices. The U.S. dairy industry continues to enjoy increased demand for its products, as shown in Figures 2 and 3. However, as depicted in the two figures, increased exports have outpaced increases in domestic demand in recent years.
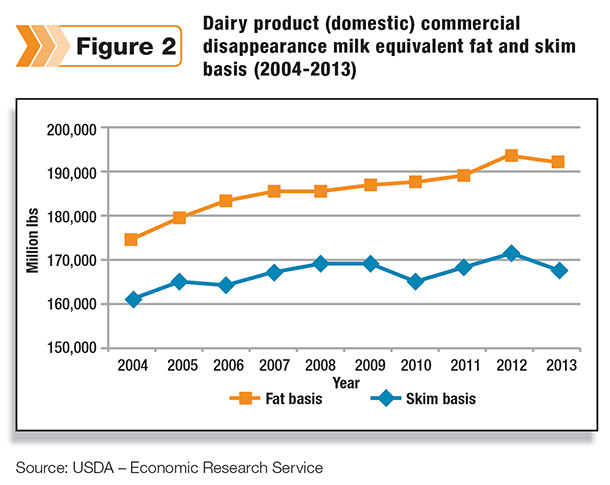
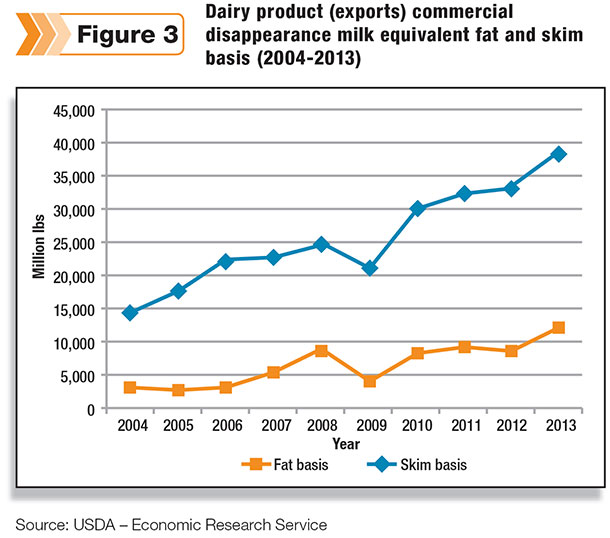
Even though commercial disappearance leveled off in 2013, exports advanced upward. In 2013, on a skim basis, exports were almost 19 percent of commercial disappearance and more than 6 percent on a fat basis. Increased dairy product exports are a primary reason for record milk prices in 2014.
Unfortunately, exports are slowing down. Since May 2014, butter exports have been below the same month in 2013. September 2014 butter exports were only 25 percent of the previous September exports. Nonfat and skim milk powder exports were down in both August and September compared to last year.
Let me interject; more than 50 percent of U.S. nonfat and skim powder is exported. Lower U.S. exports are due to the U.S. prices not being competitive, increased milk production in the European Union and Oceania (major exporting regions), and lower demand, especially in China.
Looking ahead to 2015, I expect these same factors to remain for the coming months, which indicates lower U.S. exports in 2015 compared to 2014. Not to reflect too much on 2009, but note the decline in exports from 2008 to 2009, as seen in Figure 2.
On the domestic side, there is more optimism for commercial disappearance in 2015. Lower dairy commodity prices should lead to lower retail prices, which should boost dairy sales. Hopefully, consumers will spend some of their gasoline savings on dairy products.
Overall, the economy is gradually improving, which bodes well for increased sales. Through the first seven months of 2014 compared to 2013, domestic commercial disappearance (fat-basis) is up 1.7 percent, which is positive news.
If domestic disappearance in 2015 can grow and utilize a significant portion of the additional milk expected, this is positive news for milk prices. If exports in 2015 do not suffer a significant drop, this is also good news for milk prices. If the opposite occurs, expect larger milk price declines. Watch the commercial disappearance numbers. They are a key indicator in determining the direction of your milk price.
Stocks
The third indicator is stocks or inventory of dairy products, which I consider a combination of the first two indicators. Steady or declining stocks tell us that milk supply is in balance or demand is exceeding milk supply. This helps increase milk prices. On the other hand, growing inventories tell us milk supply is exceeding demand. When this occurs, look for milk prices to move downward.
Through the first three quarters of 2014, monthly butter stocks remained below the previous three-year average for each month. Cheese stocks remained and were similar to the three-year average. Butter and cheese stocks not building contributed to their record prices in 2014.
However, October butter and cheese numbers indicate that stocks are starting to build. Nonfat milk powder stocks were steady through the first half of 2014 but have started building during the last couple of months and are exceeding year-ago levels.
With increased milk production, look for stocks of all three products to build over the next few months. Expanding stocks of butter, cheese and powder will move milk prices downward. Plus, the larger the inventories, the longer it takes for milk prices to rebound when milk supply declines.
2015 milk prices
At the beginning of this article, I provided the USDA’s 2015 milk price forecast as well as what the futures market is telling us. Now, it is my turn. Based on the three indicators just discussed, I look for the farm milk price in 2015 to average $6 per cwt or lower than the 2014 average.
The indicators point to more cows, which results in more milk – more milk than can be utilized domestically or exported, thus building inventories and lowering milk prices. However, I encourage you to watch the three indicators – cow numbers, commercial disappearance and stocks – and make your own projection. PD
Calvin Covington is a retired dairy cooperative CEO and now does some farming, consulting, writing and public speaking.
Photo by PD staff.

Calvin Covington
Retired Dairy Co-op Executive


