


Average annual milk production per cow in the U.S. increased from 18,197 pounds in 2000 to almost 23,000 pounds in 2017. That’s a 26 percent increase. These production numbers are reported and published on a regular basis. Most in the dairy industry are familiar with the significant gain in milk produced per cow.

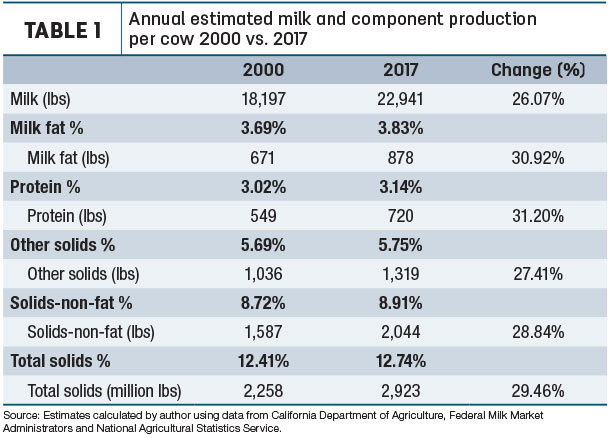
What is lesser-known and -reported, but of greater significance and economic importance, is: The components in milk increased more than pounds of milk during the same timeframe. Pounds of milkfat increased almost 31 percent, protein pounds increased more than 31 percent, and total pounds of milk solids increased 29.5 percent.
Higher percentages of milk components are why component pounds increased more than milk pounds from 2000 to 2017. Estimated milkfat content climbed from 3.69 percent to 3.83 percent, protein went from 3.02 percent to 3.14 percent, and solids-non-fat increased from 8.72 percent to 8.91 percent (see Table 1).
Increasing efficiency
Why is the milk component increase more significant than the increase in pounds of milk? Simply stated, it is the components in milk – milkfat, protein and other solids – that give milk its economic, functional and nutritional value. Without the components in milk, milk has little or no value.
With components increasing more than pounds of milk, today’s dairy cow is providing milk with more economic, functional and nutritional value, which makes the dairy cow even more efficient. Let’s look at some specific examples.
Cheese production is the majority consumer of the nation’s raw milk supply. It is the dairy industry’s star product, with per-capita consumption increasing almost every year. All else being equal, milkfat and protein determine cheese yield; higher levels of milkfat and protein mean more cheese produced from a given volume of milk. Milk with higher percentages of milkfat and protein yields more pounds of cheese (see Figure 1).
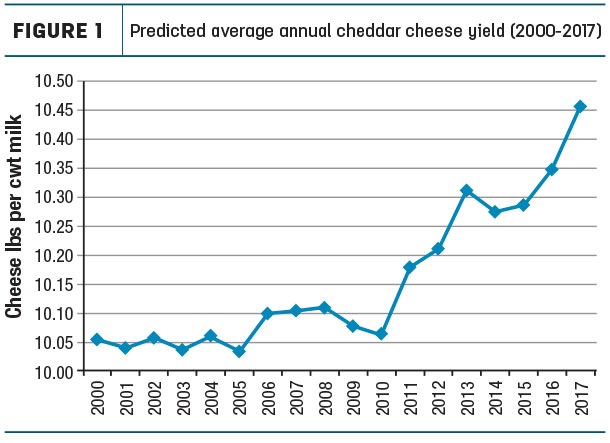
The average predicted cheddar cheese yield in 2000 was 10.05 pounds per hundredweight of milk. In 2017, the predicted yield increased to 10.46 pounds. The milk from an average cow in 2000 was predicted to produce 1,830 pounds of cheddar cheese. In 2017, the average cow’s milk had the potential to produce 2,399 pounds of cheddar, a significant increase in efficiency.
Let’s take this example further. Assume a farm pick-up milk tanker holds 50,000 pounds of milk. Using average milk components, the milk from that tanker would be expected to produce 5,027 pounds of cheese back in 2000. Due to higher milk component levels, that tanker of milk in 2017 would produce 5,229 pounds, another increase in efficiency.
The same-size milk tanker is hauling 202 more pounds of cheese in the same volume of milk. This is another efficiency gain.
Now let’s move to the cheese plant. Assume a cheese plant wants to make 500,000 pounds of cheddar cheese per day and receives milk with average component levels. The plant would receive four less tankers of milk per day in 2017 versus 2000 to make 500,000 pounds of cheese.
That means four less trucks per day to unload and wash but still make the same amount of cheese. Next, if the plant’s cheese vats held 50,000 pounds of milk, the plant would make the same amount of cheese in 2017 as in 2000 – but by making four less vats of cheese. Again, higher milk components increase efficiency in cheese plants and provide savings.
Besides cheese, higher levels of milk components increase the potential yield of most other manufactured products. In the case of drying skim milk into nonfat dry milk powder, milk with higher levels of solids-non-fat means there is less water to remove from the milk.
Again, an increase in efficiency and energy cost savings. On the fluid side, higher component levels do not result in any more gallon containers of milk produced from a hundredweight of milk, but that gallon of milk contains more protein and provides the consumer with more nutrition per glass of milk.
Why?
Why have milk component percentages increased? My simple answer: Dairy farmers respond to the signals sent through the milk pricing system. A major purpose of a milk pricing system is to provide dairy farmers with the proper economic signals to produce the components in milk with the greatest value.
Beginning in 2000, and continuing today, almost all the nation’s dairy farmers are paid for the skim portion of their milk based on solids-not-fat or protein and other solids. This is either through regulated milk pricing systems, or voluntary plans such as cheese yield, or protein premium programs that encourage production of higher component milk.
The exception is the high-fluid-utilization milk markets in the southeastern U.S., which continue to price the skim portion of milk based on volume.
In recent years, the response to the milk pricing system has occurred on the milkfat side as well. Butterfat has been a part of most milk pricing systems since the invention of the Babcock test for milkfat. For much of the past 50 years, the skim portion of milk had greater value than the fat portion of milk. Therefore, there was little economic incentive to increase milkfat.
However, in recent years, this has changed due to the fat portion of milk being greater than the skim portion in many markets. From 2000 to 2010, there was little change in average milkfat percentage. It ranged between 3.66 to 3.69 percent. As the butterfat price per pound increased, dairy farmers responded, and milkfat increased to 3.83 percent in 2017.
Dairy farmers respond to pricing signals. And the dairy industry has helped dairy farmers respond by providing more information – including articles in this magazine – on how to feed, breed and manage for higher milk components.
With my background in the Jersey breed, I must also mention the increased use of Jersey genetics. According to the National Association of Animal Breeders, Jersey represented 5.76 percent of domestic semen sales in 2000. In 2017, it was 14.81 percent. However, with the introduction of Holstein genetics into the Jersey breed, the future impact of Jersey genetics increasing milk component levels may be diminished.
Differences in component levels
Even though U.S. milk component levels have increased, they are still below the world’s other two major milk exporting regions – the European Union (EU) and Oceania. In the EU, the average milk fat percent is about 4.05 and protein about 3.35 percent. In New Zealand, during the 2016-2017 season, milkfat averaged 4.77 percent, and total protein (New Zealand tests for total protein, not true protein) averaged 3.87 percent.
Here in the U.S., there is a range of component levels across regions. The Pacific Northwest had the highest component levels in 2017: 3.99 percent milkfat and 3.24 percent protein. In fact, protein levels in this region increased from 3.02 to 3.24 percent since 2000.
Although not unexpected, Arizona has the lowest milkfat level at 3.62 percent, followed by Florida at 3.69 percent. The Northeast has the lowest protein at 3.1 percent in 2017. The Upper Midwest was the second lowest at 3.11 percent. Due to its high component levels, the predicted cheddar cheese yield in the Pacific Northwest is almost one-pound higher than in the Upper Midwest.
In summary, dairy farmers have responded to milk pricing signals by increasing milk components, especially milkfat and protein. Higher milk components increase product yield of manufactured dairy products and helps significantly improve the efficiency of the dairy industry.
This benefit increases in importance as more of the nation’s milk supply continues to be utilized in manufactured products. Looking at milk component levels outside the U.S., and regionally in this country, there is potential to continue increasing component content. ![]()

-
Calvin Covington
- Retired Dairy Co-op Executive
- Email Calvin Covington


