


Genske Mulder & Company LLP has produced averages of our dairy clients’ profit and loss reports on a quarterly basis for quite some time. Our clients, as well as others in the industry, have found these very helpful as benchmarks with which to compare their own operations.
The only shortcoming to these reports was the delay in issuance necessary to compile figures from all of our clients.
In response to this issue, we have created the National Dairy Advanced Index in order to provide more timely numbers regarding the current financial conditions facing the dairy industry. The index figures will be available within 75 days after the end of the quarter and will highlight trends in the major income and expense categories.
As much as conditions allow, the same dairies will be included in the index to maximize comparability between time periods. We will also continue to prepare our traditional industry averages, including reports based on geographical areas, which will be available at a later date.
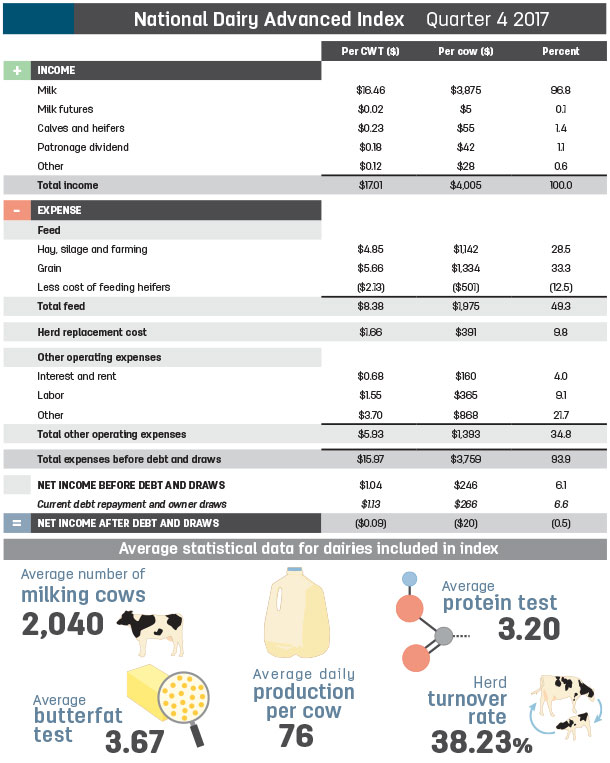
Our 2017 index includes 45 dairies from 13 states. The dairies in the index have an average of approximately 2,040 milking cows and average daily production of 76 pounds per cow.
Click here or on the image above to view it at full size in a new window.
Some key points from the year-end 2017 index:
- Average milk price came in at $16.46 per hundredweight (cwt).
- Feed costs remained relatively stable at $8.38 per cwt. Most dairies saw modest declines in their feed costs this year compared to 2016.
- Herd replacement cost remains on the high side at $1.66 per cwt as beef prices continue to linger on the low side.
- Labor costs have been rising and settled at $1.55 per cwt. Many states raised the minimum wage in 2017, and some of those increases were substantial. A labor shortage has also been felt in many parts of the country, which has led to a bidding war for employees.
- Net income declined since the third quarter. Even some of the financially stronger and efficient dairies experienced breakeven or losses during fourth quarter.
Overall, 2017 was a profitable year. Average net income was $1.04 per cwt and $246 per cow. So why doesn’t it feel like it? Many of our clients would agree that although their dairy’s income may be in the black, they are definitely feeling financial constraints.
They are short on liquidity, and the balances on their lines of credit may be creeping up toward their limits. To understand the bigger picture, it’s important to remember what is not included in net income:
-
Debt service. Loan principal repayment is not considered an expense but is a significant cash outflow.
- Personal expenses/draws. Although these are not business expenses, they are just as necessary.
For this reason, we have factored in average debt repayment and owner draw requirements after net income on the index. After accounting for these items, the industry is basically at a breakeven point. This leaves little to no room for the other major element not included in net income: capital investments.
Dairy owners should not lose sight of the accumulated cost of deferring repairs and maintenance or delaying replacement of equipment.
Due to rising wages and labor shortages, some dairies have recently made considerable investments in systems designed to reduce labor requirements and costs. Whether they’ve gone fully robotic or somewhere in between, those who have gone this route have had to take on considerable debt to acquire these systems.
This may be a valuable and necessary investment that will hopefully pay off in the long term, but the associated additional cash outlays are not evident on the current profit and loss statement. And many of those considering moving in this direction are wondering where they will find the funds.
Looking to 2018, it appears it will be a challenging year. The milk futures market shows a significant decline in milk price. We will see continued increases to the minimum wage.
Many states, California and Colorado among them, have planned annual increases to the minimum wage through 2020 and beyond. Interest rates are rising. The LIBOR rate just about doubled during 2017 and continues to increase thus far in 2018. By the end of 2017, the prime rate was the highest it’s been in almost 10 years.
This will be a difficult time to secure new financing. Those who have properly managed their balance sheet and liquidity situation in recent years will have the advantage in weathering the storm.


