


With the volatility in milk prices this year, many questions have been asked by dairy producers about whether or not they should use available tools to potentially minimize the risk associated with negative milk price moves.
As producers think about this question, evaluating and understanding the financial risk of the business is one area to evaluate. Higher financial risk can indicate that it is important to manage milk price risk, but will not tell you how or how much management is required.
What is financial risk?
Dairy farmers face many types of risk including price, production, legal, human resource management, and financial risk. Financial risk is defined as the possibility of adverse business outcomes associated with financing, including the risk of default. Financial risk is the potential that a business may not be able to meet its cash commitments, from covering ongoing operating expenses to covering family draws and meeting debt obligations. Inability to meet cash commitments could have further consequences that might include loss of inputs, outside support services, collateral, and access to outside capital.
Financial risk on dairy farms changes based on a number of different factors and events. One is the use of debt. Higher debt increases risk, all else equal, because creditors get paid first (i.e., have liens on the collateral used for debt). In addition, financial risk may increase because of increasing interest rates, higher cash demand for family needs, disruptions to earnings, and lack of adequate cash or credit reserves.
Assessing the farm’s financial risk position
Financial risk can be assessed using the farm’s financial statements. Trends in performance and benchmarks relative to similar farm businesses and industry standards are useful. A second place to look for guidance on measuring financial risk is how the lender evaluates the risk of loan default. Successful lending relies on accurate assessment of loan risk. The majority of farm businesses need access to affordable outside capital for large expenditures. If a farm business is viewed as too risky by lenders, interest rates will be increased to reflect risk premiums or additional borrowing capacity will be restricted or even denied.
When assessing financial risk, four areas should be evaluated: repayment capacity, solvency, liquidity, and financial efficiency. Across these four areas, many different ratios can be analyzed.
Table 1 highlights selected measures in each of the four areas as well as performance thresholds.
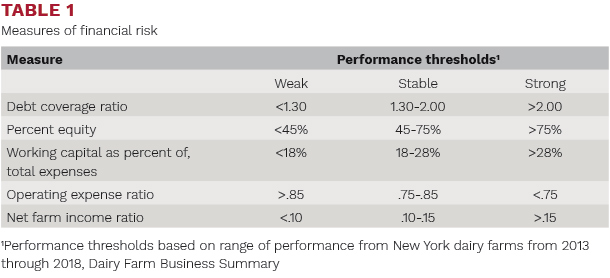
As the “weak” thresholds in Table 1 are approached for the measures, challenges may increase in meeting cash commitment needs. The perceived risk of default by lenders may also increase, potentially impacting interest rates and access to capital. Thus, the closer the farm financials are to issues with repayment capacity, solvency, liquidity, or financial efficiency, the more important it is that tools be used to avoid crossing these thresholds. It may be the case that there are opportunities to use milk price risk tools to protect these values. In this way the financial analysis helps to alert farm managers that they may need to allocate time and effort to price risk management.
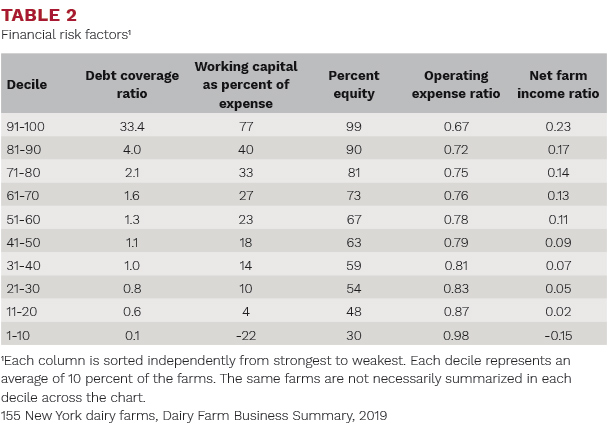
Table 2 displays the performance across these risk measures for 155 New York dairy farms from 2019, with each column sorted independently from strongest to weakest.
Repayment capacity
What is the ability of the business to service debt payments over the next 12 months? Is there sufficient or excess cash or earnings after expenses and family withdrawals to cover planned principal and interest payments?
Debt coverage ratio, the measure selected, is defined as capital debt repayment capacity divided by planned principal and interest payments. Capital debt repayment capacity is net farm income plus net non-farm income minus family living and income takes plus interest paid on term loans. From Table 1, preferred values are greater than 2.0 but the threshold for caution is when it falls below 1.3 over time. For 2019, the debt coverage ratio ranged from 17.5 to -0.1, or from having $17.50 available to service a dollar of principal and interest to actually being negative, or needing $0.10 to cover expenses and family draws with nothing available to service principal and interest (Table 2). The debt coverage ratio is based on earnings, so it does not reflect cash that may have come in through other sources, such as sale of capital assets or contributed capital. The higher the debt coverage ratio, the less risk that farm may have for meeting debt payment obligations.
Solvency
What is the ability of the business assets to cover all liabilities if the family chooses to exit the business? If the business utilizes borrowed capital, what is the relationship between assets and liabilities within the business?
Percent equity represents the portion of the assets on a market value basis that would be returned to the family after paying all liabilities (i.e., assets owned free and clear). Percent equity is calculated by dividing total net worth by total assets from a market value balance sheet. Percent equity ranged from 30 to 99 percent in 2019 for participating farms, with 75 percent and greater considered strong. The higher the percent equity, the less risk for covering all liabilities at the time of business exit, if that time ever came.
Liquidity
What is the ability of the business to meet financial commitments over the next 12 months? Does the business have the ability internally to absorb any negative impacts that might occur associated with price or production changes?
Working capital as a percent of total expenses provides an indicator of the business’ ability to handle financial shocks. Working capital is the amount of current assets in excess of the current liabilities divided by total farm expenses. As working capital increases, likelihood is stronger that the farm could absorb financial losses without having to access outside capital, reflecting an increased ability to self-insure. Working capital ranged from 77 to -22 percent in 2019. If working capital is below 18 percent over time, this could lead to higher reliance on borrowed capital, if earnings are decreased or negative for a period of time.
Financial efficiency
With financial risk centered on the ability to meet cash commitments, earnings is a critical factor to measure and understand. When thinking about a negative price change and what impact this has on the ability to meet cash commitments, net earnings has a direct impact.
The operating expense ratio measures how much of each dollar of revenue is used to cover operating expenses, before interest and depreciation. The lower this value, the greater the ability of the farm to meet commitments without having to utilize working capital or outside capital. In 2019, the operating expense ratio ranged from 0.67 to 0.99, with values below 0.75 considered strong over time.
Net farm income ratio, a second measure, represents how much of each dollar of revenue is left over as returns to the family for labor, management, and capital. The higher the net farm income ratio, the greater the ability to meet financial commitments without utilizing working capital or outside capital. Net farm income ratio ranged from a high of 0.23 to a low of -0.15 in 2019, with greater than 0.15 considered strong over time.
An accurate assessment of the financial risk position involves all aspects of the financial measures discussed above. No farms are likely to be in the top deciles of all measures. Individual farm and market situations including recent expansions which increase debt may change ratios for better or worse. Table 2 displays the distribution of these measures from the 2019 Cornell University Dairy Farm Business Analysis Summary. These deciles can help locate farm performance, and this chart can be used by placing a mark where a farm’s value was within the range for 2019. Being in the lower percentiles across these measures indicates challenges related to financial performance.
As thresholds are approached in repayment capacity, liquidity, solvency, collateral and earnings, it is increasingly important that milk price risk be offset. For example, as repayment capacity approaches 1.0 (that is as it threatens to be less than one dollar available to service one dollar in debt), then it is imperative that the likelihood of milk price falling below the threshold necessary to protect repayment capacity be minimized.
However, if the business has a strong working capital position or high percent equity, they may have the ability to absorb the impact internally and spend less effort utilizing various risk tools. In this way, examining financial risk helps determine whether risk management is needed but, importantly, does not tell a manager what they should do. A number of milk price risk management tools are available and the preferred option depends on managerial preferences, cost, and market situation.
This article appeared in PRO-DAIRY’s The Manager in November 2020. To learn more about Cornell CALS PRO-DAIRY program, visit PRO-DAIRY Cornell CALS.


