Over the last three- to four-decade period, the beef industry has made great use of genetic selection tools to improve economically important traits. Much of that improvement is due to the implementation and use of expected progeny differences (EPDs).

Since beef producers are generally paid for their animals on the basis of weight, or in some cases, by the merit of animal carcasses, most EPDs reported in breed association sire summaries involve growth traits and carcass traits. Carcass trait EPDs are valuable tools producers can utilize as they work to achieve beef quality endpoints.
USDA quality grades are an indication of expected eating quality (i.e., tenderness, juiciness and flavor) of the meat from a carcass and are determined by carcass marbling (flecks of intramuscular fat) and carcass maturity. The eight USDA quality grades (listed best to worst) include Prime, Choice, Select, Standard, Commercial, Utility, Cutter and Canner. Generally, increases in marbling result in better quality grades.
USDA yield grades (YG) indicate the beef carcass’s yield of boneless, closely trimmed, retail cuts from the round, loin, rib and chuck. Yield grades are influenced by the external fat on the carcass, the kidney, pelvic and heart fat, the carcass loin eye area and the hot carcass weight. USDA yield grades range from 1 (lean and heavily muscled) to 5 (fat and lightly muscled).
To gauge how the beef industry is doing in delivering quality end products to consumers, National Beef Quality Audits (NBQA) have been conducted approximately every five years since 1991. The NBQA results provide a snapshot of the type and/or quality of beef being produced at the time of evaluation and project the type and/or quality of beef currently needed in the industry. Strategy workshop participants from the most recent (2016) NBQA suggested the beef industry needed the following mix of quality graded carcasses: 5% Prime, 70% Choice, 25% Select and 0% Standard.
However, 2016 NBQA results showed the industry producing the following mix of carcasses: 4% Prime, 69% Choice, 24% Select and 3% Standard. Additionally, the 2016 NBQA suggested the beef industry needed the following mix of yield- graded carcasses: 10% YG 1, 45% YG 2, 40% YG 3, 5% YG 4 and 0% YG 5. However, the 2016 NBQA results showed the following mix of carcasses being produced: 10% YG 1, 36% YG 2, 39% YG 3, 12% YG 4 and 3% YG 5. Based on this information, improvements in yield grade are needed, and the gains in quality grade that have occurred over the years need to be maintained.
While the beef industry can be pleased with the improvements it has made in terms of quality grade, needs and/or changes are on the horizon. In a presentation at the 2018 Beef Improvement Federation (BIF) meeting, it was suggested that due to the growth in premium beef programs, the beef industry carcass quality grade needs could be 15% Prime, 45% upper two-thirds Choice, 30% low Choice and 10% Select going forward.
To assist beef producers in their quest for quality, breed associations have developed several carcass trait EPDs through the collection and analysis of actual and ultrasound measurements. Examples of carcass trait EPDs available for use include Marbling, Rib-eye Area, Fat Thickness, Carcass Weight, Shear Force and Yield Grade. Following is a description and example of how to interpret and use some of the carcass trait EPDs.
Marbling (MARB)
Marbling EPD is expressed in marbling score units and represents the sire’s ability to transmit marbling (intramuscular fat) to his offspring compared to other sires. When measured at the same age endpoint, sires with larger MARB EPDs will have progeny with carcasses that possess more intramuscular fat than sires with smaller MARB EPDs. Marbling is the primary factor included in the determination of USDA quality grades. In the example presented in Table 1, Bull #1 has a MARB EPD of +0.25, and Bull #2 has a MARB EPD of +0.50.
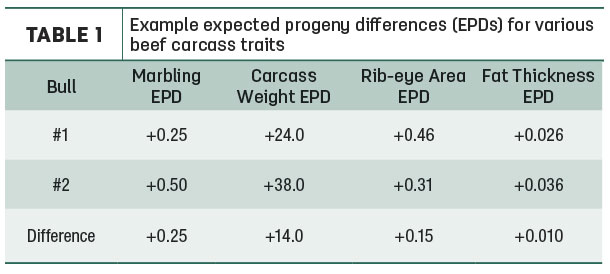
This suggests that Bull #2, when bred to a group of beef females, would sire calves that, on average, would have 0.25 more marbling score units than calves sired by Bull #1. Those 0.25 marbling score units are equivalent to a quarter (0.25) of a USDA quality grade.
Carcass Weight (CW)
Carcass Weight EPD is expressed in pounds of hot carcass weight and represents the sire’s ability to transmit carcass weight to his offspring compared to other sires. At the same age endpoint, sires with larger CW EPDs will have progeny that exhibit heavier hot carcass weights than sires with smaller CW EPDs. Hot carcass weight is one of the factors included in the calculation of USDA yield grades. Increases in hot carcass weight result in improvements in yield grade. In the example presented in Table 1, Bull #1 has a CW EPD of +24.0, and Bull #2 has a CW EPD of +38.0. This suggests that Bull #1, when bred to a group of beef females, would sire calves that, on average, would have 14-pound lighter carcass weights than calves sired by Bull #2.
Rib-eye Area (REA)
Rib-eye Area EPD is reported in square inches and indicates the area (size) of the longissimus dorsi muscle between the 12th and 13th ribs and represents the sire’s ability to transmit rib-eye size (muscling) to his offspring compared to other sires. At the same age endpoint, sires with larger REA EPDs will have progeny that exhibit heavier with more muscling than sires with smaller REA EPDs. Rib-eye area is one of the factors included in the calculation of USDA yield grades. Increases in rib-eye area result in improvements in yield grade.
In the example presented in Table 1, Bull #1 has a REA EPD of +0.46, and Bull #2 has a REA EPD of +0.31. This suggests that Bull #1, when bred to a group of beef females, would sire calves that, on average, would have 0.15 square inch larger rib-eye areas than calves sired by Bull #2.
Fat Thickness (FAT)
Fat Thickness EPD is measured and reported in inches and is a prediction of the amount of 12th-rib fat thickness of a sire’s progeny. At the same age endpoint, sires with smaller FAT EPDs will have progeny that exhibit leaner carcasses than sires with larger FAT EPDs. Fat thickness is the primary factor included in the calculation of USDA yield grades. Increases in fat thickness are detrimental to yield grades. In the example presented in Table 1, Bull #1 has a FAT EPD of +0.026, and Bull #2 has a FAT EPD of +0.036. This suggests that Bull #1, when bred to a group of beef females, would sire calves that, on average, would have a tenth (0.10) of an inch less backfat than calves sired by Bull #2.
Today, beef producers have excellent tools to estimate the genetic worth of animals for a number of economically important traits, including those related to beef end products. As producers make sire selection decisions, they should choose bulls that have the potential to optimize the values and expression of carcass traits in the herd. The selection objectives for carcass traits should be in balance with the selection objectives of other economically important traits, and the animals should be placed in environments where they can exhibit their full genetic potential. ![]()
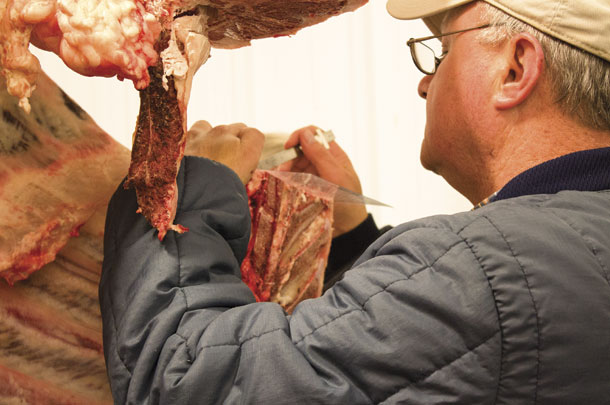
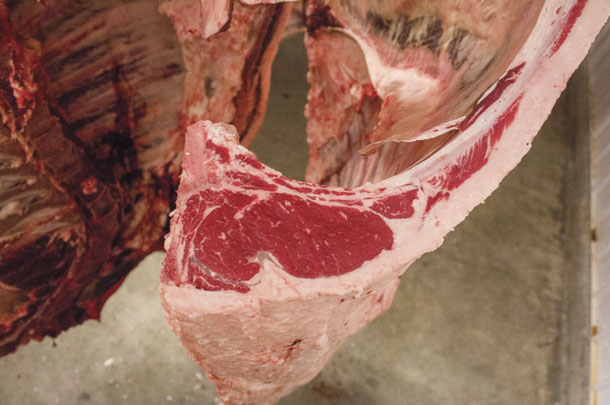
PHOTOS: The author is shown inspecting a carcass in a test program conducted with producers and the University of Idaho. Carcass trait quality is gaining greater emphasis with several breeds in their EPDs. Photos by Ray Merritt.

-
J. Benton Glaze Jr.
- Extension Beef Cattle Specialist
- Department of Animal and Veterinary Science
- University of Idaho
- Email J. Benton Glaze Jr.