


Excluding February 2021, which had one fewer production day than February 2020 due to leap day, the year-over-year monthly milk production decline was the first since May 2019-20, when COVID-19 pandemic market disruptions led to widespread implementation of base-excess programs.
October 2020-21 recap at a glance
Reviewing the USDA preliminary estimates for October 2021 compared to October 2020:
- U.S. milk production: 18.515 billion pounds, down 0.5%
- U.S. cow numbers: 9.4 million, down 14,000 head
- U.S. average milk per cow: 1,970 pounds, down 6 pounds
- 24-state milk production: 17.711 billion pounds, down 0.3%
- 24-state cow numbers: 8.901 million, up 4,000 head
- 24-state average milk per cow: 1,990 pounds, down 6 pounds
Source: USDA Milk Production report, Nov. 18, 2021
Cow numbers continue to drop
Cow numbers declined for a fifth consecutive month and are now the lowest since September 2020. October 2021 U.S. cow numbers were down 14,000 from the revised September estimate and also down 14,000 head from October 2020. Since peaking in May 2021, U.S. cow numbers are now down 107,000 head.
In the 24 major dairy states, October 2021 cow numbers were still up 4,000 from a year earlier but down 15,000 head from the revised September estimate. The 24-state dairy herd is now down 95,000 head from the May 2021 peak and is the lowest since October 2020.
Compared to a year earlier (Table 1), October 2021 cow numbers were reported higher in nine states and lower in 11 states; California, Oregon, Utah and Vermont were unchanged.
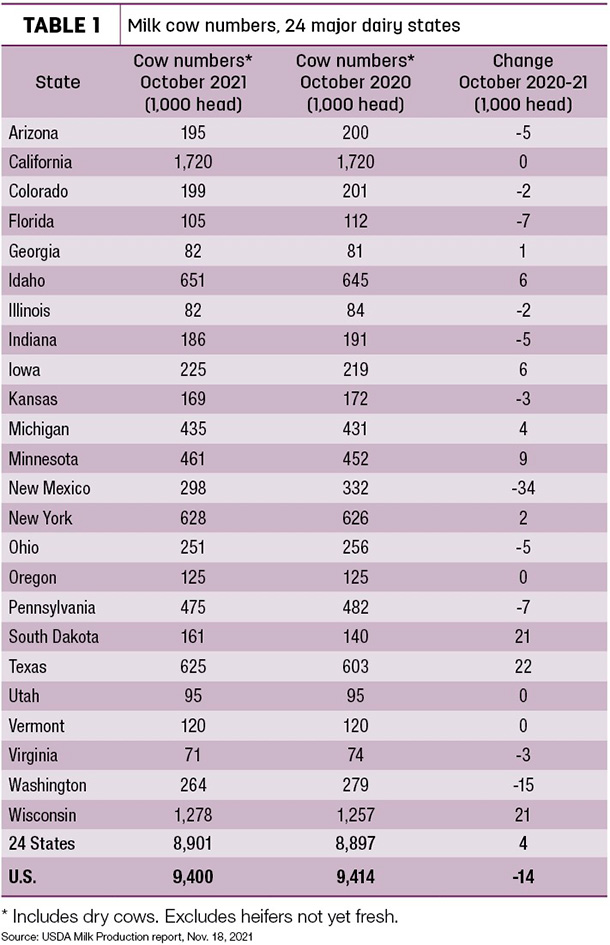
As usual, Texas led all states in year-over-year growth in cow numbers, up 22,000 head, but was unchanged from September 2021. Compared to a year earlier, dairy cow numbers grew by 21,000 head each in South Dakota and Wisconsin, with Minnesota up 9,000 and Idaho and Iowa each up 6,000 head.
Following recent trends, New Mexico (-34,000), Washington (-15,000) and Pennsylvania (-7,000) again saw the largest declines from a year earlier, down a combined 56,000 head.
Compared to a month earlier, Michigan cow numbers were down an estimated 4,000 head, with Ohio and Indiana each down 3,000 head.Following recent trends, New Mexico (-34,000), Washington (-15,000) and Pennsylvania (-7,000) again saw the largest declines from a year earlier, down a combined 56,000 head.
As usual, Texas led all states in year-over-year growth in cow numbers, up 22,000 head, but was unchanged from September 2021. Compared to a year earlier, dairy cow numbers grew by 21,000 head each in South Dakota and Wisconsin, with Minnesota up 9,000 and Idaho and Iowa each up 6,000 head.
Dairy cull cow slaughter; a switch to beef semen
The monthly Milk Production report continues to reflect USDA’s cull cow slaughter estimates, as well as tight income margins exhibited in the Dairy Margin Coverage (DMC) program. The use of beef semen in a portion of the dairy herd is also likely having an impact.
According to a summary for the week ending Nov. 6, dairy cull cow slaughter at federally inspected plants was higher than the corresponding week a year earlier for 22 consecutive weeks, dating back to early June. Cull dairy cow slaughter is up about 60,000 head compared to that period a year earlier.
The higher slaughter numbers, however, don’t account for the full decline in cow numbers. Another factor may be less availability of dairy replacement heifers as more producers breed at least a portion of their herd to beef sires.
Erick Metzger, general manager of National All-Jersey Inc., notes National Association of Animal Breeders (NAAB) data shows a substantial jump in domestic beef semen sales beginning in 2018, up 59% from 2017. Sales in 2018 would affect calves born in 2019, which would impact heifers entering milking herds in 2021.
That trend could continue. NAAB data for 2019 and 2020 indicates an even greater increase in domestic beef semen sales; 2020 sales were up 78% compared with 2018, with some of the increase used in dairy cattle.
Margin improves slightly
The U.S. average dairy farmer income over feed cost margin calculated under the DMC program improved in September, the first month-to-month increase since last spring. Milk prices moved to a three-month high, while corn and soybean meal prices softened. Nonetheless, the September margin of $6.93 per hundredweight (cwt) still marked the eighth straight month in which the DMC milk income margin was below $7 per cwt. Read: September DMC margin improves to $6.93 per cwt
The October DMC margin and potential indemnity payments will be announced on Nov. 30.
Milk per cow weaker
With tighter margins affecting feeding management, overall monthly U.S. production per cow fell 6 pounds compared to October 2020, with a similar decline across all major states (Table 2).
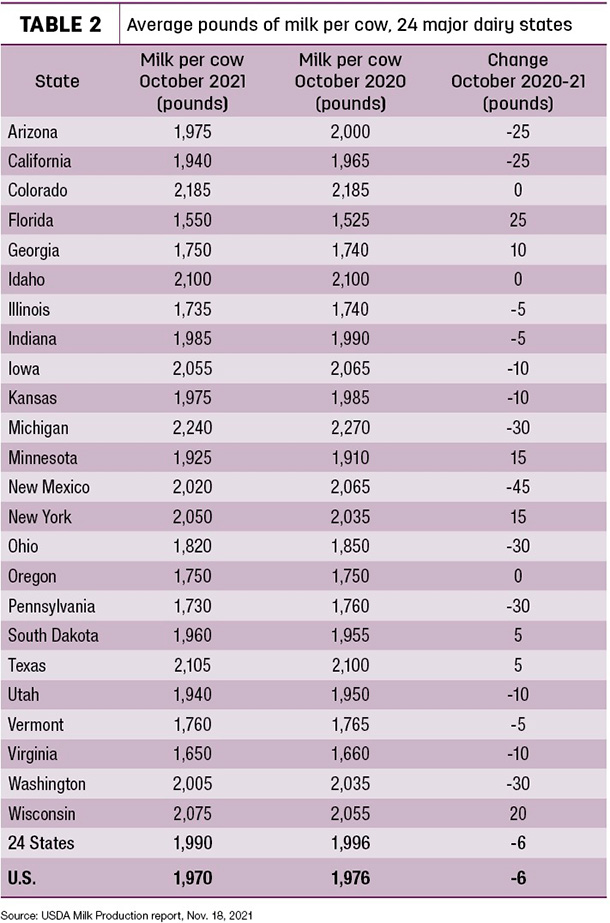
Only seven states saw October 2021 milk production per cow increase from the same month a year earlier, led by Florida, Wisconsin, Minnesota and New York, up a modest 0.5 to 0.8 pound per day. In contrast, 14 states saw per-cow output decline from the year before. Largest declines were in New Mexico, down 1.5 pound per day, and Washington, Michigan, Ohio and Pennsylvania, each down about 1 pound per day during the month.
Milk volume, percentage dips
Lower cow numbers and weaker milk output per cow pushed overall milk production down from a year earlier.
Among major dairy states, year-over-year production was down in 15 states, led by declines of 84 million pounds in New Mexico, 43 million pounds in California and 39 million pounds in Washington.
Wisconsin led all states in terms of October 2021 milk volume growth, up 69 million pounds from. Texas production was up 50 million pounds, with South Dakota production up 42 million pounds and Minnesota up 24 million pounds. New York and Idaho production grew by 13 million pounds and 12 million pounds, respectively.
On a percentage basis, October 2021 output in South Dakota was up more than 15% from a year earlier. More subdued growth occurred in Texas (3.9%), Minnesota (2.8%) and Wisconsin (2.7%). New Mexico and Washington led decliners, down 12.2% and 6.9%, respectively. ![]()
-
Dave Natzke
- Editor
- Progressive Dairy
- Email Dave Natzke


