


As management and genetics improve, the average bulk tank somatic cell count (SCC) may decline. Bulk tank SCC is a combination of the milk of all cows, so high-SCC cows are diluted by low-SCC cows.

On several occasions in the past year, farmers have told me: “My bulk tank SCC is low, and my cows are producing well, so there is no need to be testing my cows for SCC. I can manage it at the herd level.”
Herds with a low bulk tank SCC may think there is no impact on production; however, that may not be the case. Averages don’t tell the full story. Testing individual cows is essential.
DRMS data from 2019-20 shows that herds with bulk tank SCC less than 100,000 still have approximately 12% of cows with a linear score above 3 (100,000 SCC). For herds averaging 100,000 to 200,000 SCC, this number goes up to 23% of the herd. This article digs a bit deeper into trends, the economic losses from mastitis and the tools available to manage your udder health and minimize the impact on your farm.
Relationship between SCC and production losses
Research shows that when a cow’s SCC rises above a linear score of 3, the animal may be impacted by subclinical mastitis and experience a drop in milk production. The typical belief was: The impact on cows was the same throughout the lactation, with older-lactation cows having higher losses than first-lactation cows. However, research has shown that losses vary based on lactation and stage of lactation.
Figure 1 shows that first-lactation as well as second-and-greater-lactation cows experience a slight reduction in milk loss from calving until mid-lactation.
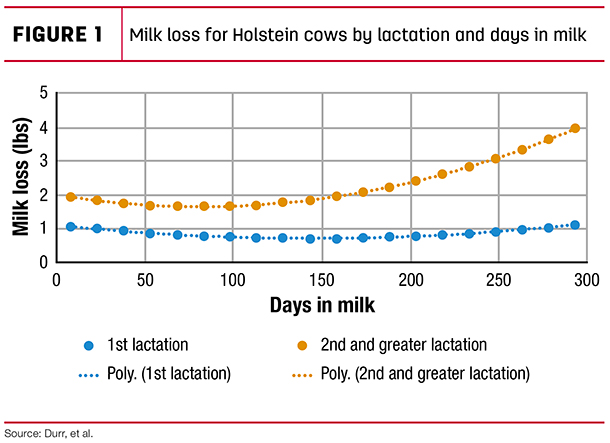
After mid-lactation, milk loss per day increases. For second-and-greater-lactation cows, daily loss by 300 days in milk is double the loss at 100 days in milk.
Other research has shown that the number of consecutive months a cow experiences high SCC (linear score greater than 3) will influence the rate in milk production loss per day. For example, a chronic cow with two consecutive months of high SCC would lose 2.68 pounds of milk per day. However, if the same cow has had four consecutive months of high SCC, that loss rate increases to 3.23 pounds per day.
Based on this research, it is important to recognize that not every cow with a high cell count will experience the same milk loss. The combination of stage of lactation with frequency of high SCC influences the rate of daily milk loss. Therefore, to manage milk losses and increased costs of managing mastitis, it is important to continue managing mastitis at the individual cow level while using bulk tank SCC as an overall indicator for the herd.
Impact of season
The overall trend in the U.S. dairy industry is a steady decline in SCC. As management continues to improve, herds are lowering SCC, and overall udder health in the U.S. has steadily improved. This trend is apparent in DRMS data as shown in Figure 2.
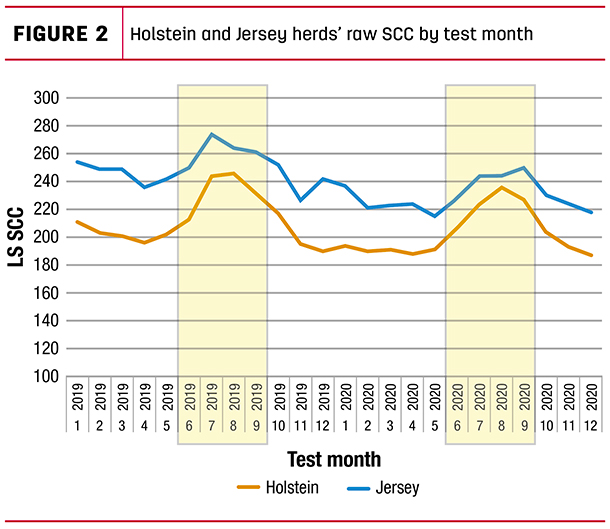
Using DRMS data from over 1.2 million cows, the chart shows the decline from 2019 to 2020. However, during the June-through-September time frame, SCC increases by about 40,000 cells. Holstein and Jersey cows from across the U.S. exhibit the same trend.
Figure 2 shows the overall trend for herds across the U.S. Additionally, there are regional differences where summer heat and humidity are less impactful.
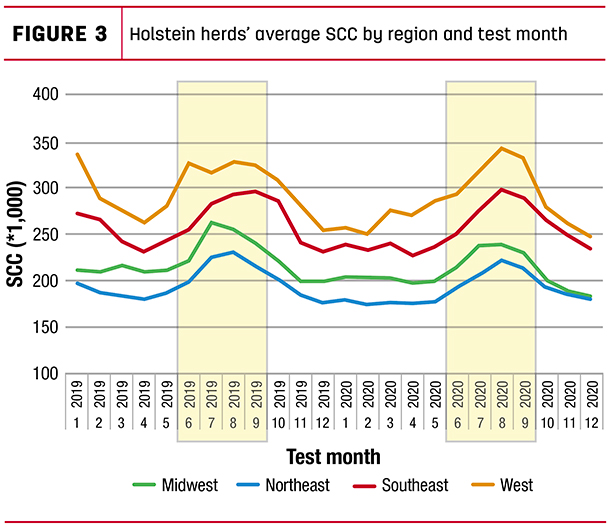
Figure 3 shows the Holstein herds’ data broken down by four U.S. regions. Although the overall regional levels are different, the trends remain the same. All regions see an increase during the summer months.
Monitoring the overall SCC trend points at a seasonal effect. However, another important measure to monitor are the infection rates in the herd. An infected cow is defined as a cow with an SCC equal to or greater than 200,000. Chronic infected cows have two or more consecutive months with an SCC equal to or greater than 200,000.
Figure 4 shows the infection rate by month and breed. Infection rates increase during the summer by about 2% as compared to the spring, indicating more cows have an SCC above 200,000, which will increase milk production losses.

Figure 5 shows a breakdown of infection rates showing the percentage of cows that are chronic infected, newly infected, fresh cows infected and cured cows.
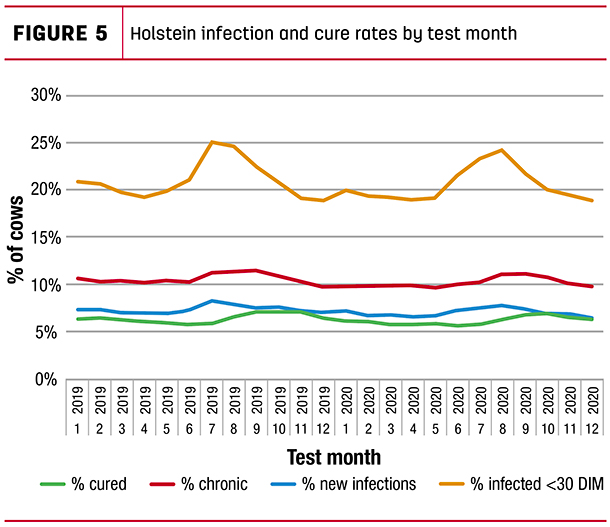
Fresh cow infection rates are derived from cows that were tested within 30 days of freshening with SCC greater or equal to 200,000 as a percent of number of cows fresh less than the 30 days in milk. Cured is defined as previous month SCC equal or greater than 200,000 and current month below 200,000.
Researchers found that minimizing fresh cow infection rates is very important because fresh cows have greater daily milk production losses.
Economic impact
To illustrate the potential economic impact milk production losses have on a typical herd, we will use the example of a Holstein herd that milks around 1,000 cows. Using the DRMS data, we see that in March 2021 the herd infection rate was 17% of milking cows (i.e., cows with SCC of equal or greater than 200,000). This infection rate is typical for Holstein herds as shown in Figure 4. Milk production losses were calculated adjusting for lactation number and days in milk. Milk loss is based on a baseline of a cow with a linear SCC score of 3. The total estimated loss in milk production for the day of test was 980 pounds. At $18 per hundredweight (cwt), this translates to an opportunity to gain $176 per day.
What options do I have to improve my udder health?
To seize the opportunity to recover some of these losses, the first step is to monitor your monthly DHI milk testing records. Monitoring individual cows that are infected is a start. Identify high-SCC cows (equal to or greater than 200,000), determine if these cows have mastitis, and decide if these cows need to be treated. If your bulk tank is too high, an easy solution is to pull the milk from you highest-contributing cows. The DHI contribution to the bulk tank SCC is calculated using the combination of a cow’s milk weight and SCC score on test day.
Although selecting cows that need treatment is important, analyzing key trends is equally important to get the most complete picture of how well your overall management is working. A monthly test provides the most consistent way of monitoring progress. Start by monitoring infection rates such as new infections, chronic infections, fresh cow infections and cure rates. This will provide you with an overall monthly assessment. For example, when new infection rates are higher than cure rates, your problems are growing. Increased fresh cow infection rates could suggest you should evaluate the transition cow or dry cow program – or the heifer raiser if the problem occurs in first-lactation cows.
DRMS provides several reports to help dairy producers quickly identify specific cows with high SCC. The SCC Report (DHI-241) provides each individual cow’s contribution to the bulk tank. The SCC Management Report (DHI-340) also includes a list with each cow’s contribution to the bulk tank and a summary of infection rates by lactation group, SCC distribution by lactation and stage of lactation, and SCC distribution by linear score for the current test. In addition, this report offers a trend for the past 12 months and the estimated loss from cows with high SCC.
The most comprehensive report is the Udder Health Monitor (DHI-427). It provides historic trends and benchmarks for your herd. Aside from showing test-day summarized data, the monitor lists cows to watch, including newly infected or chronic infected cows.
Summary
In summary, managing your herd’s udder health requires more than monitoring the bulk tank and a cow’s daily milk production. Daily milk losses may be small when compared to the overall daily milk production of the cow, but these small amounts add up. The higher percentage of cows infected, the higher your total losses per day will be.
The solution is to obtain monthly DHI SCC data to allow the herd manager to monitor individual cows and select those cows requiring closer attention. In addition, the DRMS udder health summary reports offer more in-depth information about trends in the herd. They also provide information to determine potential problem areas.


