


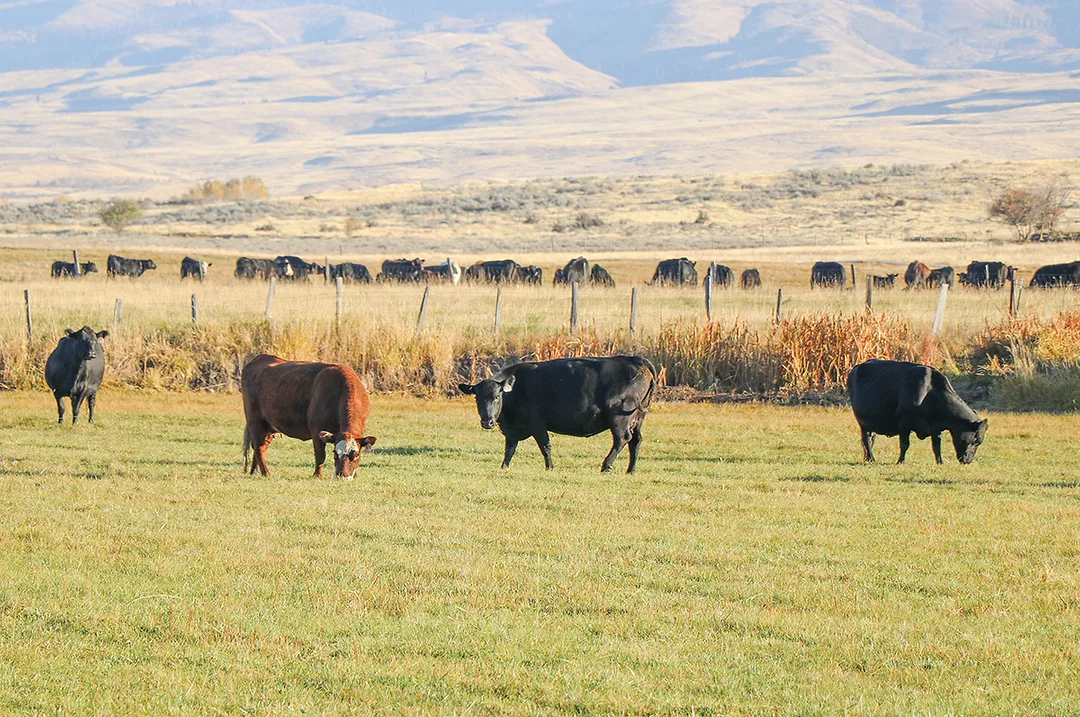
U.S. beef cow inventory totals dropped for another year, down to 27.9 million head at the start of 2025 – still the lowest total since 1962 and the sixth consecutive year for beef cow inventory decline in the country.

The total cattle and calf inventory also shrunk to 86.7 million head of livestock, still the lowest in 74 years and a decline of 0.6% from the previous year.
The toll could be seen in overall beef production on a global scale, as the U.S. saw its total output drop 1.1% to 12.1 million metric tons (MT) of total beef. That amounted to 19.9% of total beef production on a global scale. Brazil saw significant increases in its production with 0.4% total increase, up to 11.9 million MT, and a 3.1% increase in beef/veal exports, up to 3.75 million MT shipped.

Among the top five countries in beef production, China saw its volume decline 0.6% to 7.7 million MT, and the European Union also dropped 1.2% to 6.6 million MT, followed by India’s growth of 1.5% to 4.6 million MT.
A decline in U.S. supply led to large growth in import demand. Imports from Australia jumped 67% in both volume (373,098 MT total) and total value ($2.8 billion) from the year previous. Canada remained the second-largest exporter to the U.S., although volume and value did see a decline. But imports from Brazil went up 77% in volume to 234,353 MT and 68.3% in overall value to $1.4 billion, as the third-biggest exporter into the U.S.
Overall, total volume and value of imports saw significant increases of 25% (1,589,759 MT) and 24% ($11.2 billion spent), respectively.
On the export side, the U.S. saw a 1% decline in overall total export volume to 1.29 million MT shipped of beef and beef variety meat. The value side registered a 5% total increase in money raised to $10.5 billion. Japan and South Korea saw respectable increases of 3% and 4% value to $1.8 billion and $2.2 billion, respectively. Mexico bought 232,488 MT and spent $1.4 billion, a 10% increase, on U.S. beef.

About changes to USDA data
This year’s map reflects new reporting on U.S. inventories of cattle as a result of revised policy following the 2022 Census of Agriculture. The USDA’s National Agricultural Statistics Service (NASS) gathered stakeholder input in fall 2023 and announced changes to balance resources across those programs in the annual survey estimate.
NASS has reduced the number of states showing beef cow number estimates from 50 to just 31. Those states with beef cow numbers less than 1% of the U.S. inventory and less than 1,000,000 head of cattle no longer have a state survey number. Their estimate is shown in the listing of “other states.”
The U.S. map in the poster still includes each state’s survey number for cattle and calf inventory, and total cows inventory. To the left of the U.S. map, a new table is shown ranking all 31 states that do have a beef cow estimate in 2025.
Likewise, we have removed states’ cattle on feed from the U.S. map, since NASS has cut the number of states showing those data to just 11 states.


