Corn silage is far and away the most important ensiled crop in virtually all U.S. dairy areas. As in most aspects of life, where we want to receive all of whatever it is we pay for, losses of corn silage post-harvest during the ensiling period represent an economic loss to the dairy industry.


This loss, generally referred to as “shrink,” is the proportion of the fresh crop weight not recovered from the pile as feedable silage.
Shrink can refer to wet weight (WW) recovery of silage, oven-dry weight (oDW) recovery or oven-dry matter (oDM) corrected for volatiles lost in the drying oven (vcoDM). But however you express it, shrink can be costly. For example, 10 percent WW shrink on a 15,000-ton corn silage pile represents a loss of $90,000 if WW corn silage is valued at $60 per ton.
In addition to an economic loss to a dairy farmer, shrink can represent a loss of carbon compounds to waterways as weepage from the pile, or to aquifers as seepage, or to the atmosphere as gases.
As such, these silage losses have attracted the attention of various U.S. regulatory agencies tasked with reducing environmental impacts of farming as a way to create cleaner water and air. These regulatory efforts have, in some cases, resulted in semi-mandatory mitigations to dairy farmers to reduce silage shrink.
So what is an achievable corn silage shrink loss and what factors impact it?
Shrink numbers in the commercial literature are commonly in the 5 to 20 percent range, and numerous management strategies have been suggested to reduce it: use of an inoculant at chopping, building piles on a concrete base, creating high pack density at silage pile building, use of a plastic cover, rapid covering of the mass with that plastic cover, use of an inner plastic film, use of an inner film with enhanced oxygen-barrier characteristics, use of weights on the plastic, sealing the periphery of the pile with dirt or weights, minimizing exposed face at feedout, removing the maximum possible depth of silage at feedout, maintaining a “smooth” silage face, using moveable weight lines along the cut surface of the plastic, only removing as much silage as is immediately needed, use of mechanical defacers, use of block cutter defacers and leaving no overnight piles of loose silage.
Quite an extensive list.
Defining shrink
The most common definition for shrink is the proportion of the WW fresh crop, which is packed into a silo structure (including a pile) and is later placed into a TMR mixer. Under this definition, spoilage that is removed by hand (in most cases) and disposed of by land application or feeding to heifers counts as shrink.
However, shrink (as defined by air and water boards) typically includes wastage, since this material is actually recovered (and not “lost”). The interpretive limitation of WW shrink is that much of it will be water, which has no substantive economic or environmental impact. Thus, some dairy producers and regulatory boards also measure shrink on an oDW basis.
To convert WW shrink to oDW shrink, it is necessary to collect many samples of fresh-cut crop at ensiling as well as collect many samples of the silage put into the TMR mixer.
This is a time-consuming chore which involves collecting and pooling many samples over the period of silo structure building, as well as many samples over the often long feedout period, in order to create pooled samples representative of the crop ensiled and of the silage fed out.
Both of these tasks are prone to poor practices and poor samples that are not representative of the fresh-cut crop ensiled or the silage placed into the TMR mixer.
While these issues can be dealt with by using defined sample collection protocols, a serious structural issue is that this oDW shrink estimation procedure will always overestimate real DW shrink by adding volatile carbon compounds lost during oven-drying to the shrink estimate.
In other words, an oDW shrink of 10 percent might only be about 5 percent when corrected for the volatiles lost during oven-drying.
The base problem with oDW shrink is that drying a fresh-chopped corn crop in an oven will almost exclusively drive off water, since very few volatile carbon compounds are in a fresh-chop corn crop, but drying corn silage in an oven will drive off volatile carbon compounds, most of which will actually be fed to the cows, as well as water.
Sources of shrink
Shrink losses of corn silage originate from many facets of the ensiling process, such as during pile building after the fresh-chop material is weighed but prior to plastic covering, from the mass while it is ensiled, from the silo “face” at (or near) its exposure to air, during the defacing operation, after silage has been defaced but before it is moved to the TMR mixer and, finally, during transport to the TMR mixer – which is typically where the amount of fed-out silage is measured.
But we had questions. The first question area addressed the issue of the extent of corn silage shrink as WW, oDW and vcoDW because that focuses on the extent of the silage shrink “problem” from the perspectives of dairy farm economics as well as potential impacts on air and water quality.
The second question area addressed the issue of where in the entire process (as outlined above) shrink is occurring because that suggests where mitigations should be focused to reduce it.
Finally, the third question area addressed the issue of which ensiling practices and characteristics exacerbate or mitigate shrink, and where that mitigation occurs in the entire ensiling process, because that suggests where mitigations would likely be more or less efficacious in terms of reducing shrink.
The research
To see if we could narrow down the shrink culprits, we conducted research using eight corn silage piles (two rollover, one bunker, five wedge) ranging in size from 1,052 to 13,470 tons, on concrete (five), dirt (two) and a combination base (one), on four dairy farms in two areas of the San Joaquin Valley from the 2013 crop year.
All piles had been covered within 48 hours by professional crews with an oxygen-barrier inner film and black/white outer plastic weighted with tire chains. The silage was fed out by professional crews using an electronic silage tracking system.
The extent of the losses in the silage piles during fermentation (in the pile) was measured by burying a grid of 14 Dacron mesh bags of fresh crop in four piles at filling and recovering them from the face at silage removal.
Losses from the exposed face was measured by coring “new” (freshly exposed) faces and “old” (about 18-hour exposed) faces, and losses between defacing and the mixer were measured by differences between the “new” face and the “drop-down” piles placed in the mixer.
Conclusions
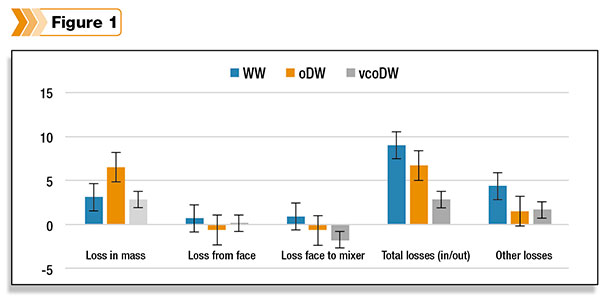
We found that losses are measurable from most phases of the ensiling process and occur at relatively low levels. However, percentage losses from the face are, quantitatively, far from the most important shrink losses, which are summarized in Figure 1.
The extent of silage shrink has been greatly overestimated in large well-managed commercial corn silage piles, likely due to incorrect assumptions and inappropriate research models to measure it.
However, the most important reason may have been due to failure to measure real shrink (i.e., vcoDM) in favor of WW shrink, which is exaggerated due to losses of water, or oDM shrink, which classes volatile compounds which are actually in the silage but lost during oven-drying, as being a part of shrink.
While the number of silage piles that we used were too small (relative to the number of definable differences between them) to allow examination of many practices commonly used to minimize shrink (and because many piles had similar characteristics by design), the commonly suggested mitigations of increasing bulk density, increasing face feedout rate and maintaining a smooth face had no discernible impact on total shrink losses, probably because these mitigations are all designed to reduce losses from the exposed face, which was a trivial contributor to overall shrink.
Only the average “age” of the pile during feedout impacted shrink, with “older” piles during feedout being associated with higher shrink, mainly for WW.
While corn silage shrink exists and can be costly to dairy producers and impactful to air and water quality, the extent of shrink in large well-managed corn silage piles is low, and the ability to mitigate shrink seems, unfortunately, to be very low due to our inability to find support for several commonly accepted mitigations.
However, dairy producers should continue to use good silage practices (i.e., common sense) in creating corn silage piles, but recognize that silage shrink is likely only to become excessive under extreme conditions. PD
P.H. Robinson is a cooperative extension specialist responsible for dairy cattle nutrition and nutritional management. He can be reached by email. N. Swanepoel and D. Meyer are with University of California Cooperative Extension – Davis; J. Heguy is with University of California Cooperative Extension – San Joaquin and Merced counties.
Photo by PDstaff.