


The price a dairy farm receives for milk is determined by a system that tries to calculate the value of the milk components based on products produced from milk. The prices for the end products of cheese, butter, nonfat dry milk and dry whey are surveyed and averaged each month.
Using these prices, the Federal Order calculates a price per pound for the milk components to reflect the market signals for the products they are part of.
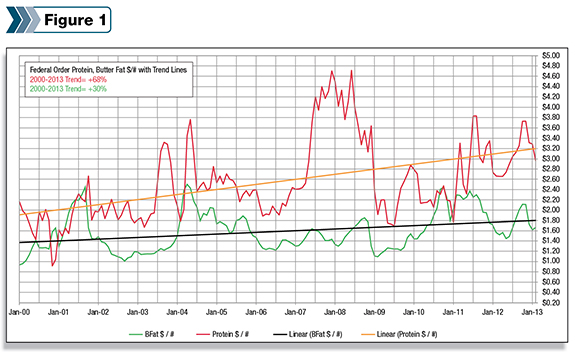
Figure 1 shows the monthly price per pound for butterfat (BF) and milk protein paid since the year 2000 along with a trend line.
The prices paid in California are not exactly the same – but are very close and would show a similar trend.
As the trends show, the value per pound of milk protein over this time period has increased nearly 68 percent, while the price per pound of BF has increased only 30 percent.
The other solids value not shown in the figure had very little value in 2000, and has increased significantly so that the solids nonfat and the skim milk value trends would be even stronger than the milk protein trend.
As the figure shows, the current trend price for milk protein is at $3.20, which would contribute $9.76 to the price per hundredweight (cwt) for milk at 3.05 percent protein. The current trend price for BF is $1.80, which would contribute $6.66 to the price per cwt for milk at 3.7 percent BF.
If the value of BF had increased at the same rate as milk protein, the price would be $2.32 instead of $1.80 and contribute $8.58 per cwt. The average price would be almost $2 higher – assuming it did not stimulate higher production.
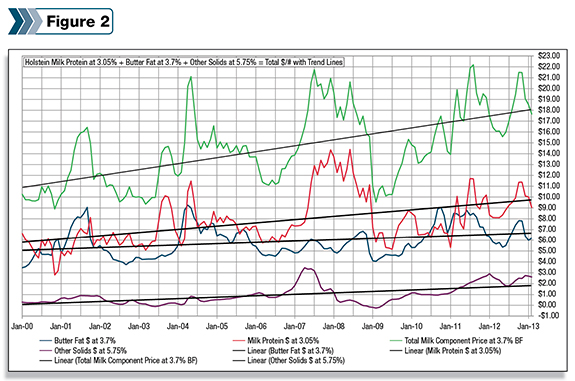
Figure 2 illustrates how much each component contributes to the price per cwt of milk based on 3.70 percent BF, 3.05 percent P and 5.75 percent other solids, along with the total of the component values and their trend lines.
The total value of the components has increased $7 per cwt or 64 percent to $18.10 over the 13-year period.
Of the $18.10, milk protein contributes $9.76 for an increase of $3.80, while BF contributes $6.70 for an increase of only about $1.65.
The trend line for other solids shows a contribution value of $1.65, but it has averaged $2.32 for the 2012 year as compared to just $.29 for the year 2000, for an increase of over $2.00.
Comparing the average contribution from BF for the same two years shows that it increased only $1.76, from $4.64 to $6.40. It is clear that the value of BF is not keeping pace with the other milk components.
Why has the price of BF increased at a much slower rate? There are likely many reasons, but the obvious one is the bad publicity saturated fats have received over the last 50 years and the trend to lower-fat fluid milk and less fluid milk consumption.
The average fluid milk currently contains less than 2 percent BF. Using the 2012 numbers for Order 33 as an example, 37.7 percent of the milk was used as Class I, but only 17.6 percent of the BF was used as Class I.
The average BF in the Class I milk was only 1.75 percent, which means over half of the BF in the original milk got shifted into other products and other classes.
Obviously, as more products are produced from the shifted BF, it tends to reduce the price when demand is less than supply. Every federal order will be different depending on the type of products produced by the BF that’s shifted from Class I, but let’s continue with 2012 Order 33 utilization numbers.
Class II products used 18.8 percent of the skim and 31.7 percent of the BF for an effective average of 6.06 percent BF. Class III products used 30.2 percent of the skim milk but used 32 percent of the BF for an effective BF of 3.9 percent.
The Class IV products used 13.2 percent of the skim but 18.7 percent of the fat for an effective BF of 5.13 percent.
It is also interesting to compare the effective class prices based on the actual BF levels instead of the standard of 3.5 percent. The 2012 Order 33 averages for 3.5 percent Class I was $19.46 before the $2 Class I differential is added.
But since the average Class I milk contained 1.75 percent BF, the effective price was only $16.64 based on an average BF price of $1.748. Class II at 6.06 percent BF averaged $20.79 instead of $16.64 at 3.5 percent.
Class III at 3.9 percent BF averaged $18.08 instead of $17.44 at 3.5 percent and Class IV at 5.13 percent BF averaged $18.65 instead of $16.01.
While saturated fats have received bad publicity, proteins – especially milk proteins – have received very good press and contributed to the development and demand for new products such as protein bars, protein drinks and higher-protein zero-fat yogurts.
The figure does show a few periods for optimism for higher BF prices. After a period of 4.5 years from 2006 through mid-2010, when the BF price was flat at the same time that milk protein was setting records, the BF price had about 18 months of above-trend prices.
These above-trend prices came at a time when the protein price was well below the trend. In fact, the BF price was actually higher than the protein price for three months. I believe some of this was because there was a return to butter by consumers as hydrogenated fats began to get even worse press.
If this trend could be capitalized on, it could make the difference that is needed to correct the current trend. Marketing efforts will likely need to put more emphasis on reversing the trend to lower-fat fluid milk products or concentrate on increasing demand for the products the milk fat is shifted to.
The problem is magnified by the fact that milk, as produced, contains about 20 percent to 25 percent more BF than milk protein. So for every additional 100 pounds of milk produced, we must find a market for 25 percent more BF than milk protein.
Unless additional demand can be created for the products which utilize the additional milk fat, the current price trends could continue.
Individual dairy producers do have an option that could positively affect their income over feed cost in the short term – and possibly the trend price in the long term. When making ration decisions, you may want to consider income over feed cost when formulating the ration.
Using Federal Order prices from January 2013, one pound of BF generated $1.62 in revenue. Since fat contains 2.25 times more calories than protein or lactose, we can calculate the benefit of converting fat calories into more milk or solids nonfat. 2.25 pounds of solids nonfat would generate $3.10 based on the January price of $1.3784 per pound.
Using the Milk Pay App available for smartphones, you can do some scenarios. For January 2013 prices, the app shows a gain of $.12 for a cow with 71.5 pounds of milk, 3.65 percent BF, 3.05 percent P, 5.8 percent other solids and a $.59 PPD compared to a 70-pound cow with a 3.8 percent BF.
These two cows are producing an equal number of component-based calories, but the cow is converting the calories into slightly different components, generating higher income.
The price of BF has ranged from $2.44 to $1.44 over the last three years, so the numbers are going to fluctuate month to month. But the BF price would have to exceed $4 per pound for this not to increase income over feed cost.
Based on these trends, if the marketing segments of the dairy industry cannot find additional markets for BF, then breeders and feeders of dairy cows should breed and feed for the more profitable components of milk. PD

Harry Stugart
Nutritionist
Ration-all Decisions


