


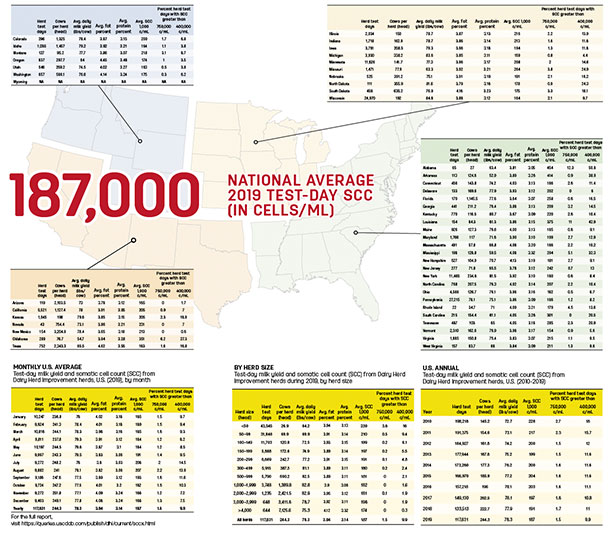
Nationally, average 2019 test-day herd SCC was 187,000 cells per milliliter, down 4,000 cells per milliliter from 2018 and a fourth consecutive year of improvement, according to the Council of Dairy Cattle Breeding and the USDA’s Animal Improvement Programs Laboratory. In fact, 187,000 cells per milliliter is the lowest average recorded in DHI since it was first calculated in 1995.
Test-day data from all herds enrolled in DHI somatic cell testing during 2019 (98.4% of all DHI herds and 96.4% of DHI cows) were examined to document the status of national milk quality. All test-day data within herds on any DHI test plan (including owner-sampler recording) were included.
Click here or on the imvage avove to view it at full size in a vew window.
Individual state data
These tables include individual state data for herd test days, average number of cows per herd, average daily milk yield and average SCC on test day. It also breaks out two categories of SCC levels: the percent of days over 750,000 cells per milliliter, the current federal limit for bulk tank SCC for Grade A producers; and the percent of test days over 400,000 cells per milliliter, the current maximum level for milk headed to European Union (EU) and some other export markets. (A few states have lower SCC limits compared to federal requirements.)
Herd test days higher than the federal limit may overestimate the percentage of herds shipping milk exceeding that limit because milk from cows treated for mastitis is excluded from the bulk tank, even though it is included in DHI test data.
State improvement
Variation in SCC among states remains large. Although climatic conditions (temperature and humidity) contributed to regional SCC levels, differences between adjacent states were substantial, suggesting herd size and mastitis-control practices are impacting state differences as well.
Average annual SCC in 20 states was less than the national average, led by Vermont, Michigan and Utah. Other major dairy states in the top 12 for average annual SCC were Idaho, Wisconsin, Arizona, Oregon, South Dakota, Washington and New York.
In contrast, South Carolina, Oklahoma, Louisiana, Arkansas and Alabama averaged more than 300,000 cells per milliliter, with averages in Arkansas and Alabama above 400,000 cells per milliliter.
Eighteen states improved annual average SCC by 10,000 cells per milliliter or more in 2019, led by New Jersey, West Virginia, Maryland, Georgia, Connecticut and Delaware, all with improvements of 25,000 cells per milliliter or more.
Others with improvements of 15,000 to 22,000 cells per milliliter were Maine, Massachusetts, North Dakota, South Carolina, Nebraska, Tennessee and Rhode Island.
In contrast, average annual SCC rose by 10,000 cells per milliliter or more in Colorado, New Mexico, Nevada, Oklahoma and Alabama.
Herd sizes compared
The increase in cows per herd was the largest on record, from 222.7 in 2018 to 244.3 in 2019. Test-day milk yield remained unchanged at 78 pounds.
In a reversal from historical trends, herds of 3,000 cows or more showed the largest SCC increase from 2018 (+12,000 cells per milliliter), while all other herd size categories improved. For the first time, the data listed herds of 4,000 cows or more. Those herds had an average SCC of 174,000 cells per milliliter, the lowest of any category.
A remaining concern is the percentage of test days for small herds over the current and possible future limits. If the limit was set at 400,000 cells per milliliter, 16% of monthly tests would fall above the limit for herds with fewer than 50 cows, 9.4% for herds with 50 to 99 cows, 6.1% for herds with 100 to 149 cows but only 0.3% for herds with over 4,000 cows.
Monthly breakouts
The last four months of 2019 showed the most improvement in SCC compared to a year earlier, led by declines of 14,000 cells per milliliter in September and November.
Perhaps reflecting the cool, wet spring of 2019, monthly SCC averages increased in February, March and April compared to a year earlier.
New fat and protein data
For the first time, the data also includes fat and protein percentages. State and national average daily milk, fat and protein yields were weighted by number of cows per herd test day. Fat and protein percentages were determined by dividing their yield averages by milk yield.
The milk with the lowest SCC and highest fat and protein percentages was produced in November and December. ![]()

-
Dave Natzke
- Editor
- Progressive Dairy
- Email Dave Natzke


