


After reaching new levels of quality in 2020, U.S. milk producers saw one measure – somatic cell counts (SCC) – post a tiny setback in 2021, based on an annual summary of Dairy Herd Improvement (DHI) test-day results.

Nationally, the average 2021 test-day herd SCC was 179,000 cells per milliliter (mL), up 1,000 cells per mL from 2020, according to the Council of Dairy Cattle Breeding and USDA’s Animal Improvement Programs Laboratory. Although small, the year-to-year increase was the first since 2014-15.
Despite that increase, the U.S. average is now down 143,000 cells per mL since peaking at the turn of the century. Prior to 2021, national average test-day herd SCC had declined every year except three since 2001.
Test-day data from all herds enrolled in DHI somatic cell testing during 2021 (98.4% of all DHI herds and 96% of DHI cows) were examined to document the status of national milk quality. All test-day data within herds on any DHI test plan (including owner-sampler recording) were included.
Individual state data
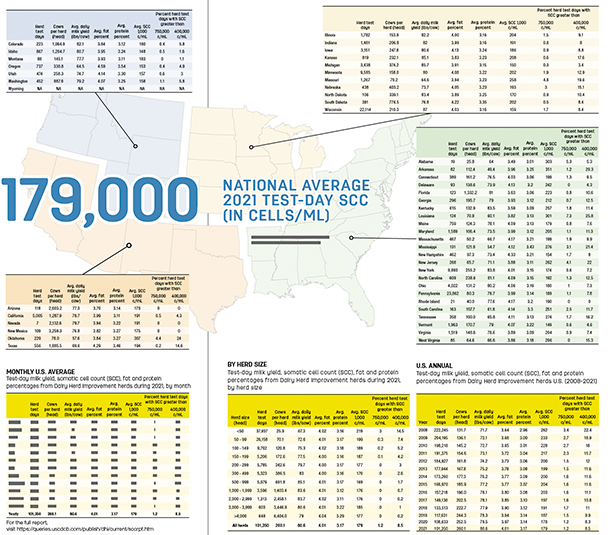
These tables include individual state data for herd test days, average number of cows per herd, average daily milk yield, butterfat and protein percentages and average SCC on test day. It also breaks out two categories of SCC levels: the percent of days over 750,000 cells per mL, the current federal limit for bulk tank SCC for Grade A producers; and the percent of test days over 400,000 cells per mL, the current maximum level for milk used to produce dairy products exported to the European Union (EU) and other markets. (A few states have lower SCC limits compared to federal requirements.)
Herd test days higher than the federal limit may overestimate the percentage of herds shipping milk exceeding that limit because milk from cows treated for mastitis is excluded from the bulk tank, even though it is included in DHI test data.
However, Federal Milk Marketing Order (FMMO) records showed milk delivered in four FMMOs in 2021 averaged 191,000 cells per mL, up about 6,000 cells per mL from 2020. Regionally, milk marketed in 2021 averaged: Upper Midwest FMMO (174,000 cells per mL, 5,000 cells per mL); Central FMMO (202,000 cells per mL, up 7,000 cells per mL); Mideast FMMO (175,000 cells per mL, up 6,000 cells per mL); and Southwest FMMO (212,000 cells per mL, up 6,000 cells per mL).
Click here or on the image above to view it at full size in a new window.
State improvement
Variation in SCC among states remains large. Although climatic conditions (temperature and humidity) contributed to regional SCC levels, differences between adjacent states were substantial.
Average annual SCC in 13 states was at or less than the national average of 179,000 cells per mL, led by Idaho, Vermont and Michigan. Arkansas, Oklahoma, Alabama and Louisiana averaged more than 300,000 cells per mL.
Twenty-five states improved annual average SCC in 2021, with 11 states improving by 10,000 cells per mL or more compared to 2020. Largest improvements were in Alabama (-63,000 cells per mL), South Carolina (-40,000 cells per mL) and Louisiana (-31,000 cells per mL).
Year-over-year annual average SCC increased in 21 states, rising by 20,000 cells per mL or more in Massachusetts, Connecticut and Nevada.
Herd sizes compared
For a second straight year, cow numbers in DHIA herds increased by about eight cows, from 252.4 in 2020 to 260.1 in 2021.
Based on herd size, year-over-year changes in SCC levels were mixed. Reversing previous annual trends, herds of 3,000 to 3,999 and 4,000 cows or more had the largest increases in SCC compared to a year earlier, up 4,000 cells per mL and 11,000 cells per mL, respectively. Also posting a small increase in 2021 were herds with 150 to 199 cows, up 1,000 cells per mL from 2020.
Monthly breakouts
2021 U.S. average SCC levels were also mixed compared to the same month a year earlier, declining every month in the first half of the year (January-June) but increasing every month in the second half (July-December).
Milk, fat and protein data
The annual report added fat and protein percentages in 2019, and both increased slightly among DHI herds in 2021. Test-day average milk yield rose about a pound to 80.6 pounds, with fat percentage up 0.04% to 4.01% and protein percentage up 0.03% to 3.17%. The milk with the highest fat and protein percentages was produced in November and December. The months with the lowest fat and protein percentages were June through August. ![]()
To see the full report, visit CDCB Research Report - Milk somatic cell count from Dairy Herd Improvemtn herds


