The value of fat held strong last year ($2.56 average through October), while the value of protein shifted wildly from just $1.19 per pound in January to $3.17 in October. How do you maximize your milk check in this new scenario where both fat and protein are highly valuable?
Not-so-simple math
My high school math teacher was big on “mental math” with exercises each week to help us learn how to calculate in our head. Twenty-plus years later, while I am still impressed with those who can rattle off the outcomes to complicated equations in their heads, it’s simply not necessary. We live in a day where we are rarely more than an arm’s length from our cellphone calculators. My bias is that even the quick cellphone math for what a pound of milk is worth versus a 1/10 of milkfat may not be enough.
Let’s do the “quick mental math” as an example. At $20 per hundredweight (cwt) milk price, one pound of milk is worth 20 cents. At $2.50 per pound of fat, a 1/10 increase on an 80-pound herd (.001 times 80 times 2.50) is also worth 20 cents. If I increase 2/10 of milkfat, but lose one pound of flow, I am still 20 cents ahead, right? While this might get us close, it’s just not that simple. Here’s what we’re missing.
When we lose a pound of milk (or gain), we ship less fat, protein and other solids. In this example, using the simple price per cwt, we gave fat and protein essentially the same value and minimized the loss of the higher value component (protein in today’s market). On the other hand, when we increase the milkfat concentration (and lose on volume), a portion of the value will be offset by the lost protein, with the offset greater when protein value is high as it is today.
Embrace your spreadsheet
Hopefully you’re convinced by now that you need to give mental math a break and embrace the complicated spreadsheet math for a truer answer on how to optimize milk flow and components for the biggest milk check. Let’s solve this same conundrum using the milk and fat valuator spreadsheet I designed to help producers simply find a more accurate answer to these “what if” decisions.
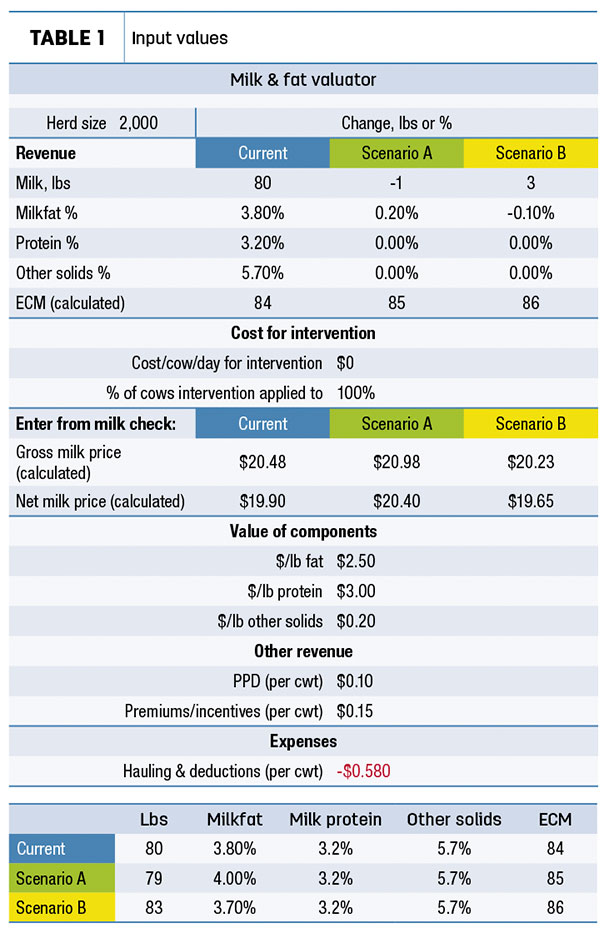
Here are the assumptions we entered (Table 1): Current performance at 80 pounds, 3.8% milkfat, 3.2% milk protein, 5.7% other solids. Scenario A is increasing milkfat percent by 2/10 but losing 1 pound of milk. Scenario B is gaining 3 pounds of milk but losing 1/10 on milkfat. All other components were held constant. Also, the milk and fat valuator has a place to enter component values off your milk check, along with the producer price differential (PPD), other premiums, minus hauling and deductions. The milk check assumptions used are $2.50 per pound of milkfat, $3.00 per pound of protein and 20 cents for other solids.
Changes in revenue
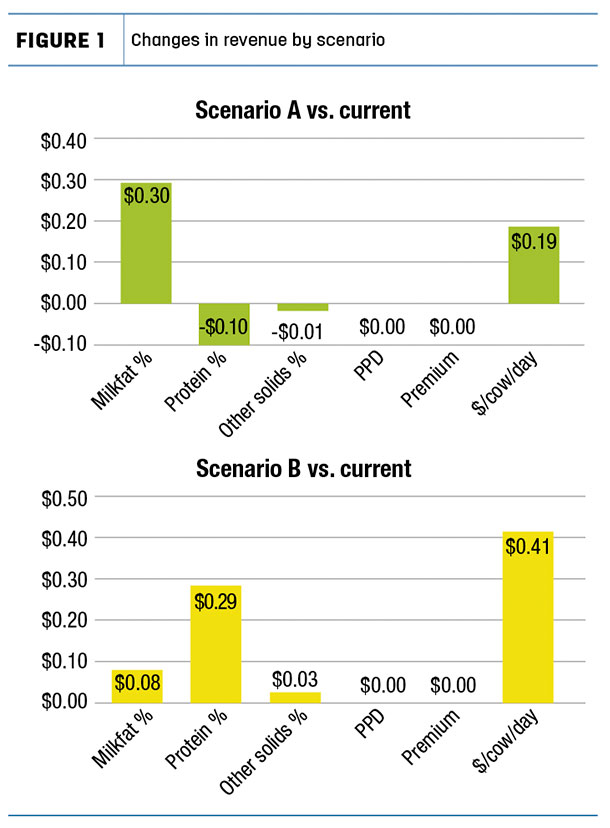
In these scenarios, both are improvements versus current performance, but Scenario B, where we gained 3 pounds and lost 1/10 on milkfat, actually gave us twice the increase in revenue. (See the per-cow breakdowns in Figure 1 for how we got there.) Scenario A, where we gained on milkfat percent and lost a pound, saw a 30 cent gain in milkfat revenue but lost 10 cents on protein and 1 cent on other solids due to lost milk volume, netting an increase of 19 cents per cow per day. In Scenario B, we gained just 8 cents on milkfat since we shipped more fat due to flow, yet lost some on percent. And the majority of the gain was on protein volume at 29 cents, with an added 2 cents from other solids, which nets out at 41 cents more revenue per cow per day.
Net milk value
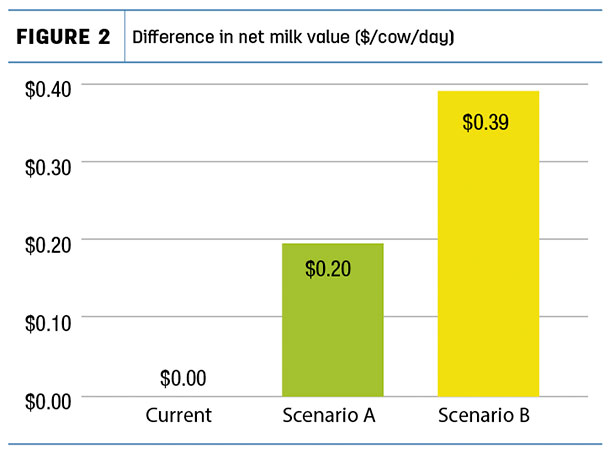
That was simply revenue, but what about the net milk values? Remember, we don’t want to “ship water,” or so we’ve been told. How do the results differ when accounting for premiums, PPD, hauling and deductions that are typically calculated on total hundredweights shipped? Interestingly, the results on a per cow basis varied with just a 4-cent swing, with Scenario A gaining one cent per cow to net at 20 cents per cow, due to lower hauling and deductions on less volume (Figure 2). Meanwhile, Scenario B lost 3 cents on more hauling and deductions, netting out at 39 cents per cwt. This is still by far the best option of these scenarios. And let’s not forget these few cents per cow, while they sound small, add up to big dollars when multiplied out to the herd level. On a 2,000-cow dairy, Scenario A nets over $11,000 more per month, while Scenario B nets over $23,000 per month, already including $1,400 in that net difference for added hauling and deductions with higher milk volume in Scenario B.
Pounds versus percent
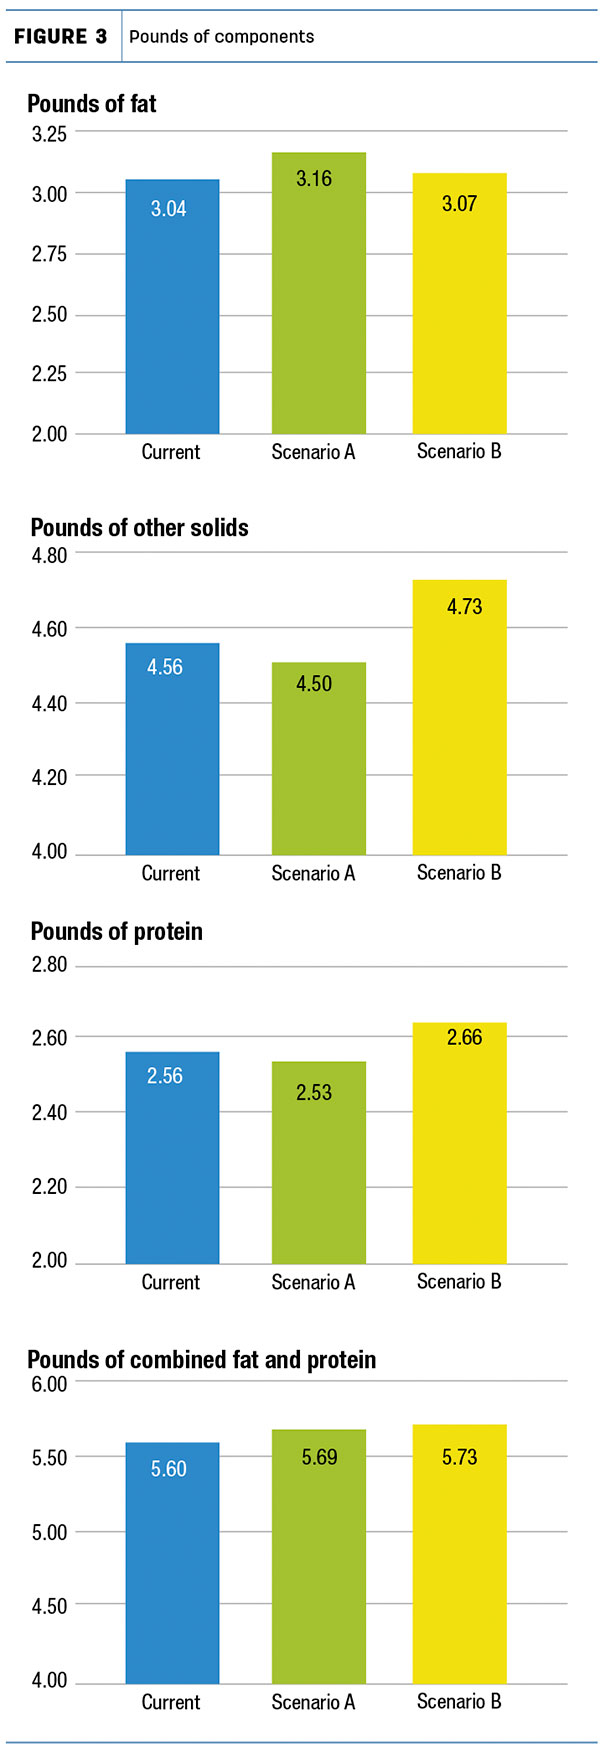
One last piece to this analysis is looking at what impact these scenarios have on total pounds of components shipped, as you get paid on pounds of components, not percent (in almost all cases). Knowing how many pounds of fat and protein you are shipping, and setting your goals on attaining these benchmarks, is far more aligned with what drives your revenue than deciding you want to hit 4% milkfat, for example. In these examples, Scenario A had the greatest increase in pounds of fat due to the increase in percent, while Scenario B had a minor increase in fat due to volume. Meanwhile, Scenario B made great gains on increasing pounds of protein and edged out Scenario A with more pounds of combined fat and protein at 5.73 pounds versus 5.69 pounds (Figure 3).
The energy trade-off
Lastly, as a reminder, more often than not we are aiming for greater components and milk flow to improve our bottom line. However, unless we are adding more energy on top of the current diet or reducing the energy tax from the immune system, there’s usually a trade-off. The nutritional changes we make to increase components often means energy is redirected from flow or body condition.
The challenge is, changes in milkfat percent are quite easy to measure, while real changes in milk flow are harder to pick up above the noise of normal variability on the dairy. Regardless of our challenge with measurement, the biology of shifting energy between flow and components is not negated.
Join me in saying no to mental math. Utilize this milk and fat valuator, your own custom spreadsheet, or other tools available on your milk-processor portal to weigh the benefits of more components versus flow and to accurately solve for the best decisions for your dairy’s bottom line. ![]()
Reference omitted but are available upon request. Click here to email an editor.

-
Renee Smith
- Western Sales Manager
- Virtus Nutrition
- Email Renee Smith


