The dairy industry has seen much change in just the past few years. Extend the timeline out further and it has seen tremendous change in terms of productivity, technology and even financials. The Northeast Dairy Farm Summary (DFS) is an excellent source of actual data from which we can make observations over the last 33 years. While the farms included generally have above-average results for the overall industry given the sophistication level of their management reporting, some continuing trends can be drawn, particularly between the most and least profitable of the group.
Differences between the top and bottom profit groups
To start, the earnings gap between the top and bottom 25 percent has widened gradually over the past three decades.
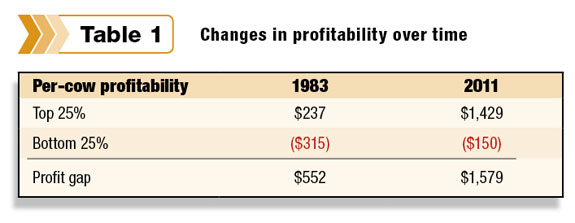
Table 1 shows the difference in profitability between the two groups was $552 per cow in 1983 and $1,579 per cow in 2011.
For comparison purposes, inflation increased 130.4 percent during the same time period, while the gap between top and bottom financial performance widened 186.1 percent.
Essentially this tells us that the top dairy farms continue improving over time at a much faster pace than the bottom farms.
Bottom dairy farms tend to have slower adaptation for improvements in areas such as cow comfort, nutrition, improved standard operating procedures (SOPs), labor efficiency and genetics, to name a few.
This lack of advancement leaves these less-profitable farms at risk for not only lower earnings but also lackluster results in other management areas as well.
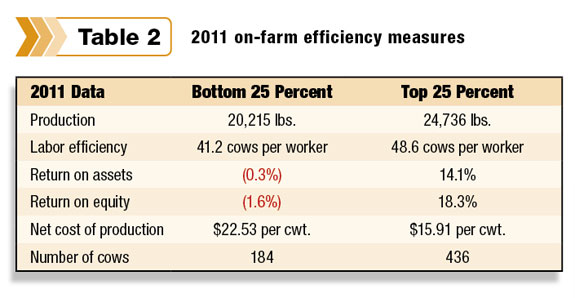
Table 2 highlights a few key areas where the bottom 25 percent tend to lag.
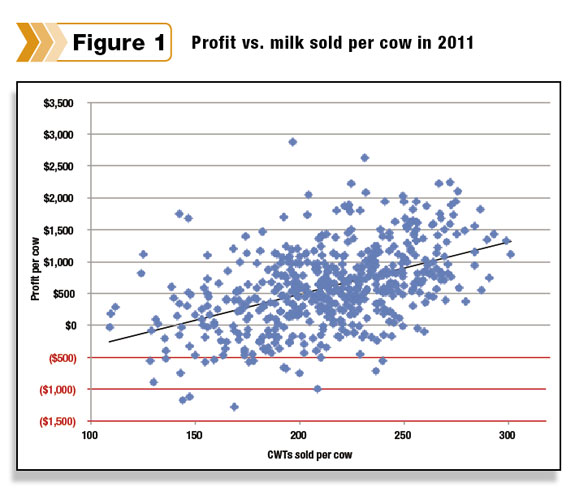
These areas are important. As you can see in Figure 1 , there is indeed a link between higher milk production and profit per cow. Another important point made by Figure 1 is that there were a significant number of farms with no profit (profit per cow below zero) in one of the best years in history. That will be difficult to recover from in years when profit margins are not as robust.
Management styles
It would be desirable to point to one key factor influencing higher profitability, but the fact is there are no magic bullets in dairy profitability. The top 25 percent showed a balanced distribution of management styles that the our report has summarized for many years:
• High production & great with cows: Milk production per cow is the focus. Producers spend more time and investment on cow productivity.
• Highly labor efficient: Focus is on labor efficiency, usually through economies of scale.
• Better milk price: This group receives a higher milk price on average either through high components, premiums for quality, volume and/or specialty markets (not organic).
• Strong cost control, tight with a buck: These operations focus on superior cost control, with the lowest cost of production per hundredweight. This group tends to see the highest net earnings on average.
• Balanced: There is not one specific focus in this group, but rather producers are good all-around managers. Generally, smaller farms are found in this group.
It is important to identify the management strengths of each individual farm and use them to build upon. Size does matter when determining which strategy to go with. Smaller farms must institute a different business model with less reliance on milk production if they desire to move forward without getting larger. Examples follow.
• Income diversification: Field crops, timber, maple (Northeast), vegetables, etc.
• Off-farm employment: An important source to provide benefits such as health insurance and a retirement plan.
• Reach & maintain debt-free status: This is generally a situation that evolves from a multigeneration operation, not a recent startup.
• Utilize a non-traditional business model: Graziers, purchased feed operations and organic production all fit into this category.
• Exit strategy: Develop a business plan to leave the operation.
Balance sheet
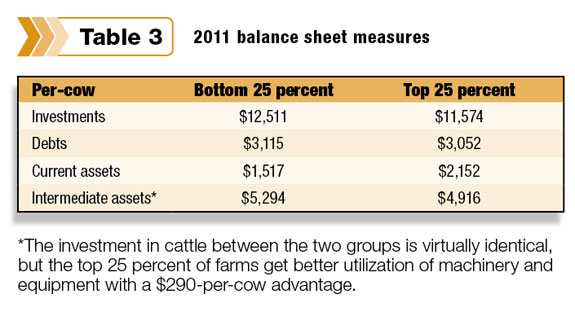
Top and bottom 25 percent farms also show significant differences on their balance sheets as well. The balance sheet is a snapshot of the farm’s financial health at a specific point in time. Tables 3 and 4 compare a few key areas of note.
Liquidity has become more and more important, particularly in the extremely volatile milk price cycles of late. It measures an operation’s ability to repay short-term obligations due in less than one year with its liquid assets. Cash equivalents are especially
important.
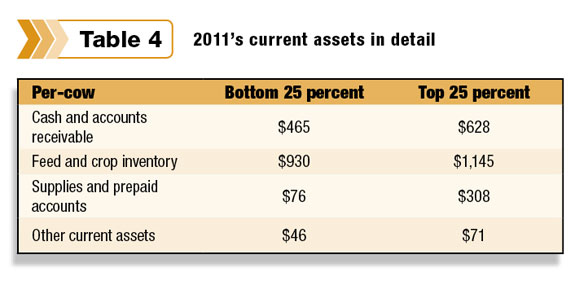
Note the differences between the top 25 percent and bottom 25 percent in Table 4 . The top 25 percent farms are much better positioned for downturns in milk price. On a per-cow basis, they have $163 more in cash and accounts receivable, $115 more feed on hand and $232 more supplies and prepaid accounts.
This equals the ability to withstand $510 more per cow of a drop in income without tapping into credit lines or vendor payables.
Generally, accrual financial reporting is used when discussing dairy farm profitability. It takes into account adjustments in feed/crop inventory, accounts receivable, accounts payable, supplies and livestock inventory changes. It’s a more accurate representation of the true results of the operation – a good crop year and high internal herd growth do count for something.
However, it neglects to show us what is actually available in terms of cash for short-term needs. “Available cash” or highly liquid assets that can be easily converted into cash is necessary to know and understand in order to make sure the bills are getting paid.
Since feed inventories and internal herd growth cannot be liquidated to generate cash if the farm is to continue expanding and feeding animals, these “inventory earnings” must be replaced with borrowed cash to meet expenses. This is the “cash-flow pinch” most dairy producers feel at some point in their careers, and it is often met with operating or revolving credit lines.
Profitability
Another major driver of profits is cost control. Lower net cost of production is another way the top 25 percent can withstand lower milk prices while continuing to pay bills. This is the single-most important risk management strategy available to any dairy producer.
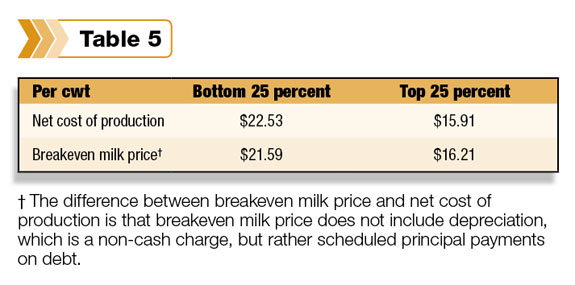
The top 25 percent of dairies have a breakeven milk price that is $0.30 higher than their net cost of production. (See Table 5.) Meanwhile, the bottom 25 percent have a breakeven milk price that is $0.94 lower than their net cost of production.
This tells us that the bottom 25 percent farms are not paying off their existing debt quickly enough to cover their machinery and equipment depreciation and will be unable to replace or update capital needs out of farm profits.
What is appropriate depreciation?
This concept of comparing net cost of production to breakeven milk price assumes depreciation is being calculated at a rate which is appropriate to cover capital replacement needs. In our rapidly inflating machinery and equipment sector, the assumption that standard depreciation can cover replacement capital needs is not valid anymore.
If we look at new capital expenditures as a percent of depreciation, we find that in the real world we need more money allocated to depreciation. For example, that $50,000 tractor purchased eight years ago is now fully depreciated and probably needs to be replaced with a $100,000 tractor.
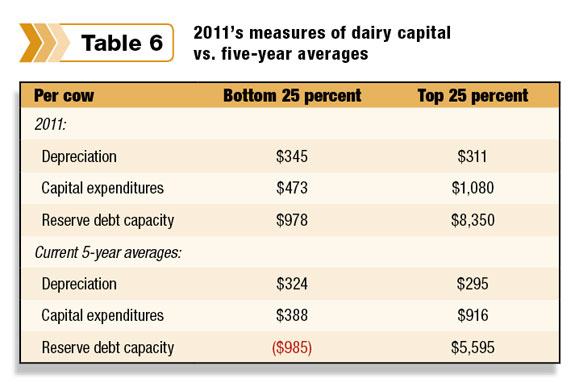
Table 6 compares results from 2011 for the top and bottom 25 percent in key capital areas. For the bottom 25 percent, the five-year average reserve debt capacity, or that which is available for capital replacement needs, is a negative $985 per cow. It’s interesting to note that all of the 2011 numbers in the table are above their five-year averages.
With continuing consolidation of farms and the actual loss of approximately 3 percent of dairy farms per year, the bottom 25 percent operations need an exit plan.
Not all farms going out of business are due to low profit margins (e.g., health, age, other interests, lack of successor), but the majority are being forced out because of a lack of profitability.
Effect of interest rates
We have been in a prolonged period of low interest rates for about four years now. When interest rates return to “normal” levels it will add approximately $90 per cow to operating costs. This is a significant percentage of profits for all farms and will reduce cash available for other purposes.
Furthermore, at “normal” levels reserve debt capacity will be reduced by at least $1,000 per cow. This stresses the importance to not be lulled into thinking that today’s low interest rates will last indefinitely – or to not think about it at all. At some point, the Federal Reserve will begin to increase rates again.
Meanwhile, in order to stay strong and competitive, progressive dairy farms must benchmark themselves against the top 25 percent group in order to thrive and to ensure their viability into the future. PD
To contact Zweigbaum for more information, Click here .

Bill Zweigbaum
Dairy Benchmark Program Consultant
Farm Credit East