


While much of September’s growth can be attributed to stronger milk output per cow, a reversal in the decline in cow numbers in some major dairy states also played a role, according to the USDA’s monthly Milk Production report, released Oct. 21.
September 2018-19 recap at a glance
Contributing to the strongest monthly year-over-year milk production growth of the year, improved milk output per cow offset a smaller dairy herd. Reviewing the USDA estimates for September 2019 compared to September 2018:
- U.S. milk production: 17.62 billion pounds, up 1.3%
- U.S. cow numbers: 9.315 million, down 53,000 head
- U.S. average milk per cow per month: 1,891 pounds, up 34 pounds
- 24-state milk production: 16.83 billion pounds, up 1.6%
- 24-state cow numbers: 8.796 million, down 11,000 head
- 24-state average milk per cow per month: 1,913 pounds, up 33 pounds
Source: USDA Milk Production report, Oct. 21, 2019
The September estimates capped a third quarter of 2019 that saw U.S. milk production increase just 0.5% from the same period a year earlier. The average number of milk cows in the U.S. during the quarter was 9.32 million head, 10,000 head less than the April-June quarter and 66,000 head less than the same period last year.
Cow numbers increase in major states
Compared to a year earlier, September’s cow numbers were down 53,000 nationally and down 11,000 in the 24 major dairy states (Table 1). However, those estimates fail to show the contraction in the U.S. dairy herd has slowed or stopped.
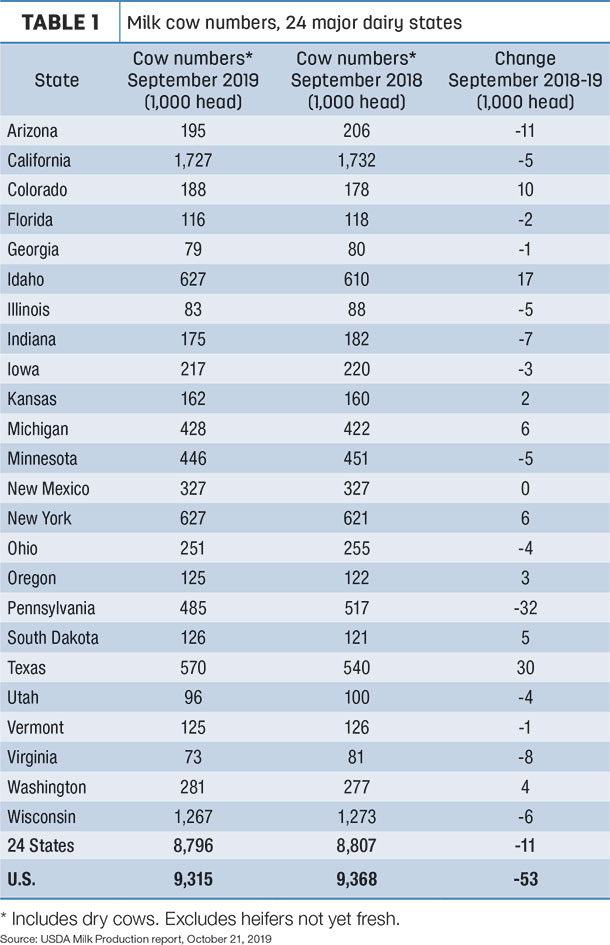
Compared to August 2019, September’s U.S. dairy cow numbers declined just 2,000 head nationally. And, among the 24 major dairy states, September 2019 cow numbers were up 7,000 from August and are now the highest since February.
Ten states increased cow numbers compared to September 2018, with the largest jumps in Texas (+30,000 head), Idaho (+17,000) and Colorado (+10,000). Largest declines were in Pennsylvania (-32,000) and Arizona (-11,000). Wisconsin, Indiana and Virginia were each down 6,000 to 8,000 head, with California, Illinois and Minnesota down 5,000 head from the year before.
Compared to August 2019, cow numbers grew by 3,000 head each in Texas and New Mexico, were up 2,000 head in South Dakota and grew by 1,000 head each in Colorado, Michigan, Ohio and Oregon. Those increases were only partially offset by declines of about 1,000 head each in California, Georgia, Minnesota, Vermont and Virginia.
Nationwide and in the 24 major dairy states, September 2019’s increase in milk output per cow compared to a year earlier was the strongest since January. Cows in 21 states yielded higher milk output per cow in September compared to the same month a year earlier (Table 2). Biggest gains were in Texas (+70 pounds) and Michigan (+50 pounds per cow), which continues to be the national leader in milk output per cow.
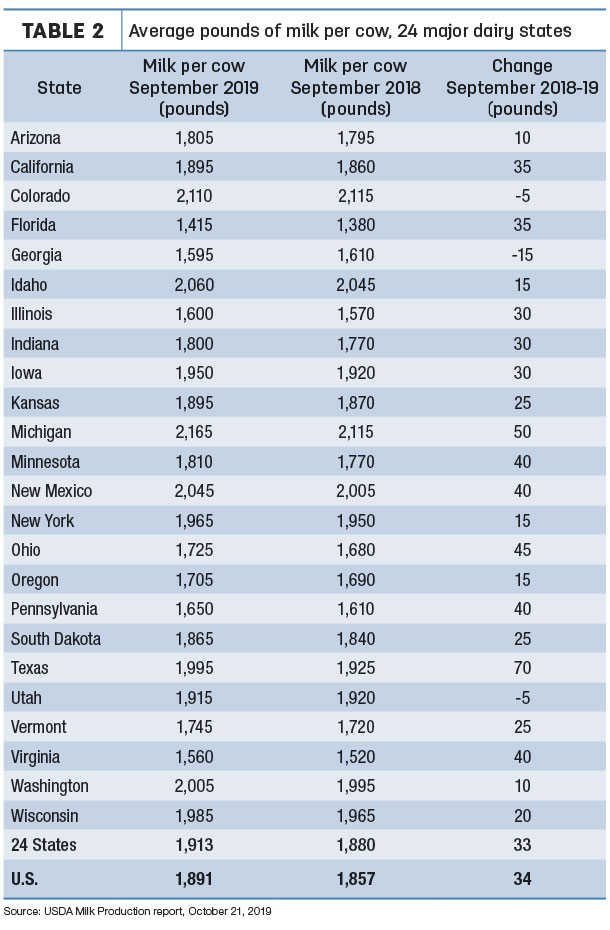
Among all major states, Texas led in terms of milk volume and percentage growth in September 2019, up 97 million pounds (9.3%) from a year earlier. California output was up 51 million pounds (1.6%), and Idaho production was up 45 million pounds (3.6%). Wisconsin milk production was up 14 million pounds, a modest 0.6% growth.
Pennsylvania production was down 32 million pounds (-3.8%), while Arizona production was down 18 million pounds (-4.9%).
The USDA’s latest outlook report raised milk production forecasts for both 2019 and 2020 but also projects slightly higher prices for most categories of milk. Higher corn and soybean prices are also forecast.
(Read: USDA forecasts more milk but slightly better prices too)
Looking at the next five quarters, the USDA forecasts highest prices in the fourth quarter of 2019, but strength in cheese prices should support Class III and all-milk prices through 2020. The 2020 all-milk price is forecast at $18.85 per hundredweight (cwt), up about 45 cents per cwt from this year’s anticipated average.
The USDA’s Livestock, Dairy and Poultry Outlook report, released Oct. 17, forecasts prices for cull cows (beef and dairy cows combined) to weaken in the fourth quarter of 2019, with the annual average $56 per cwt slightly lower than 2018’s average ($57.43 per cwt). Looking into 2020, the USDA forecast is for another $1 per cwt decline.
Cropp and Stephenson seek market clarity
The USDA’s latest numbers added confusion to dairy markets, according to Mark Stephenson, director of dairy policy analysis, and Bob Cropp, dairy economics professor emeritus at the University of Wisconsin – Madison.
In their monthly podcast, they said the improvement in milk prices has provided incentives to boost milk production, but much of the gain appears to be in increased milk production per cow – despite localized reports of lower feed quality.
Gyrating cheese markets themselves have also been confusing. Cropp said the lengthy stretch of minimal U.S. milk production growth seems to contradict an increase in cheese production.
Looking outside the U.S., Cropp said drought and environmental regulations are impacting milk production in other major dairy exporting regions.
Noting Chicago Mercantile Exchange (CME) futures have improved somewhat, Cropp remains optimistic milk prices will strengthen, averaging in the strong $17s for the first half of 2020 and the strong $18s for the second half of the year, with an overall average about $1 per cwt higher than 2019.
Stephenson expresses similar sentiments and may be even more optimistic regarding prices toward the end of 2020. He doesn’t see any signs of big surges in milk supplies in the U.S. and worldwide, but worries a global economic downturn could negatively impact demand. ![]()

-
Dave Natzke
- Editor
- Progressive Dairy
- Email Dave Natzke


